This article provides users with a general guide to the features listed.
These features may have been updated or superseded by additions found in the release notes.
Read the content below to become familiar with the feature and review the release notes to get the latest iteration.
Prerequisites
- User need to have access to Google Cloud
- User need to be registered to use Goliath providing cloud account and billing project
It is recommended to use Google Chrome browser for the best experience.
Login
Authenticating
A login prompt may display requesting authentication
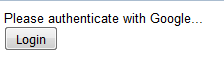
Click Login button to initiate login process
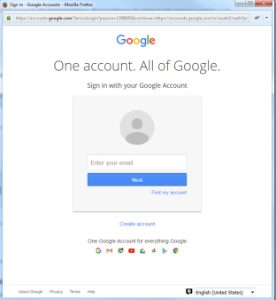 |
Access to Google BigQuery is linked to a Google account A Google account sign in will pop up prompting for authorization
|
After authenticating Goliath will display 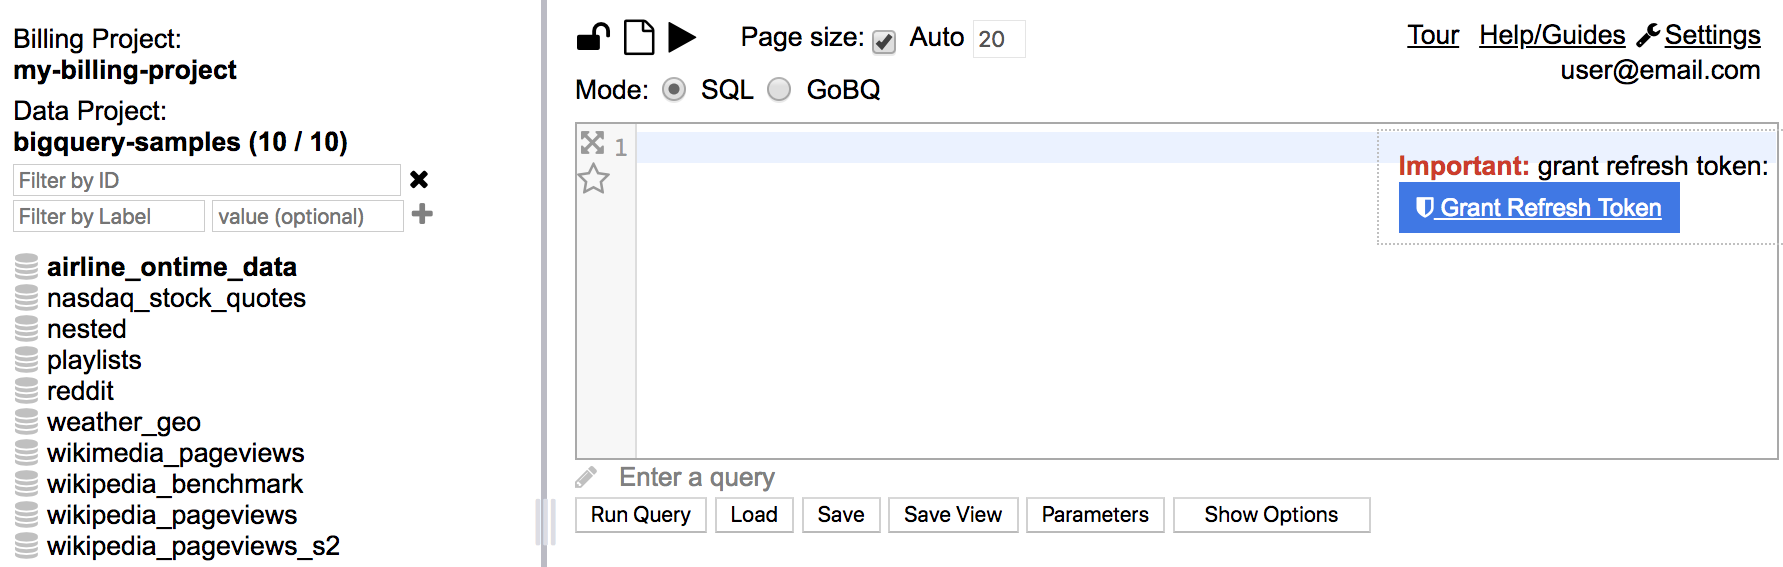
Offline Token
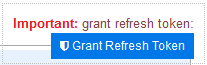 |
In upper right corner under user name is a Grant Refresh Token button Google services, including Google BigQuery, use OAuth 2.0 for Web Server Applications When first logging in Google grants single-use authorization for a short-lived access token |
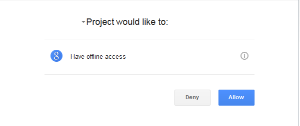 |
A popup will display a request to grant Google BigQuery project to have offline access To grant the project to have offline access click Allow |
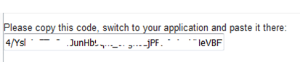 |
A window will display prompting to copy the displayed code to the application |
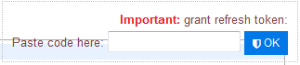 |
The Grant Refresh Token section will change to Paste code here with an input to paste the code Copy the code from the popup and paste it into the Paste code here section When pasted click OK The Grant Refresh Token/Paste code here section will disappear and the long-term access token will be granted |
Exploring the Navigator
Data is organized hierarchically. At the top of this hierarchy are projects. Each project can contain many datasets. Each dataset can contain many tables. Each table can contain many columns. The navigator enables simple exploration of this complex hierarchy.
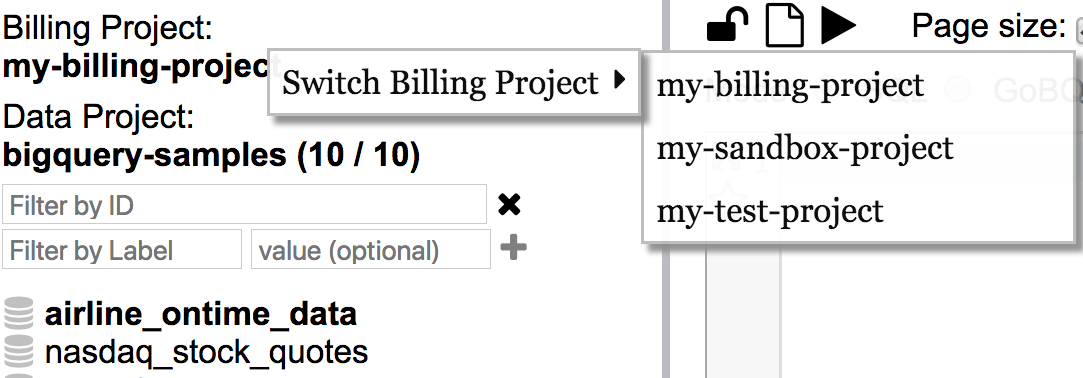
Billing project is the project where all costs will be applied to. Switch the billing project from the Billing Project Context Menu (right click on billing project header or left click on the more options icon).
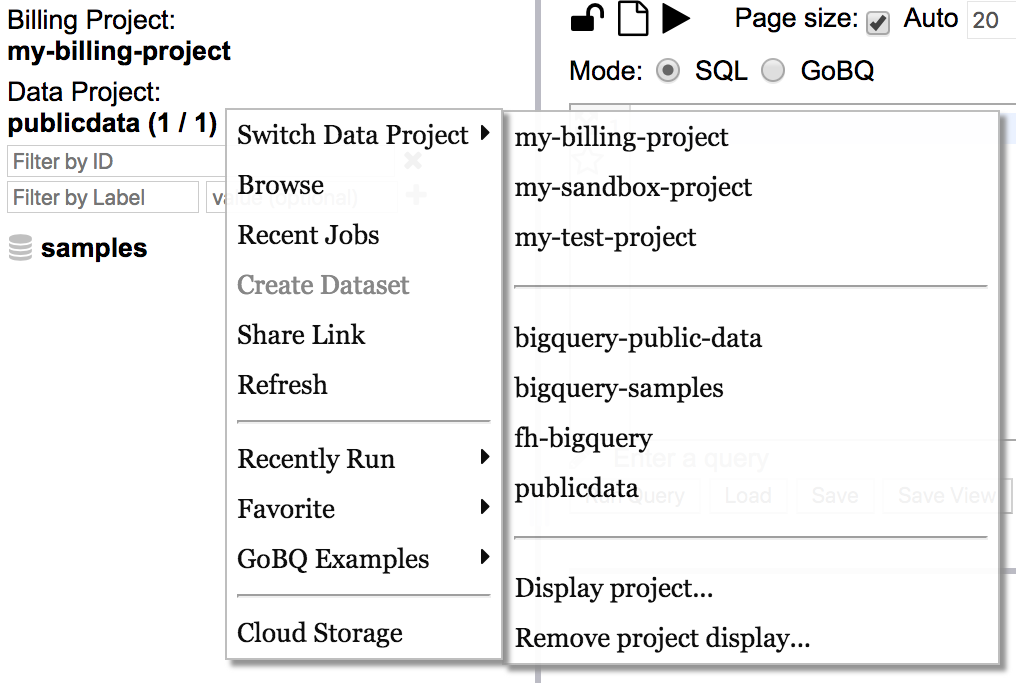
Select the data project to explore using Switch Data Project from the Data Project Context Menu (right click on data project header or left click on the more options icon).
Find a specific dataset by typing all or part of the name into the "Filter by ID" textbox.
Regular expression can also be used when filtering datasets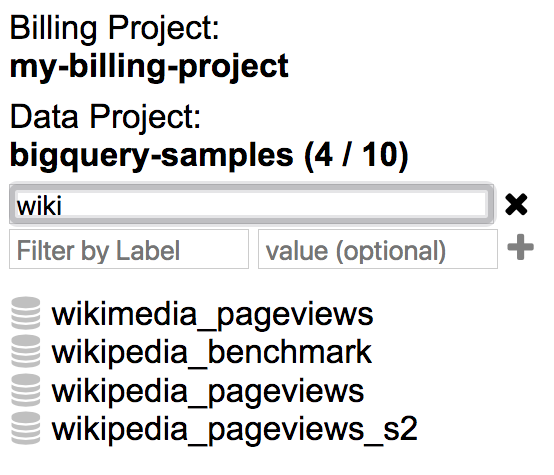
Expand datasets and tables by left-clicking on them.
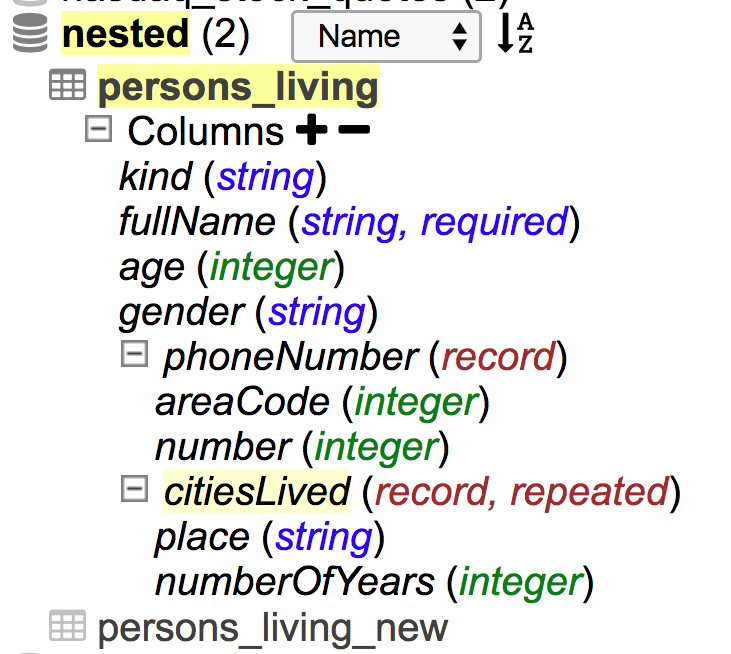
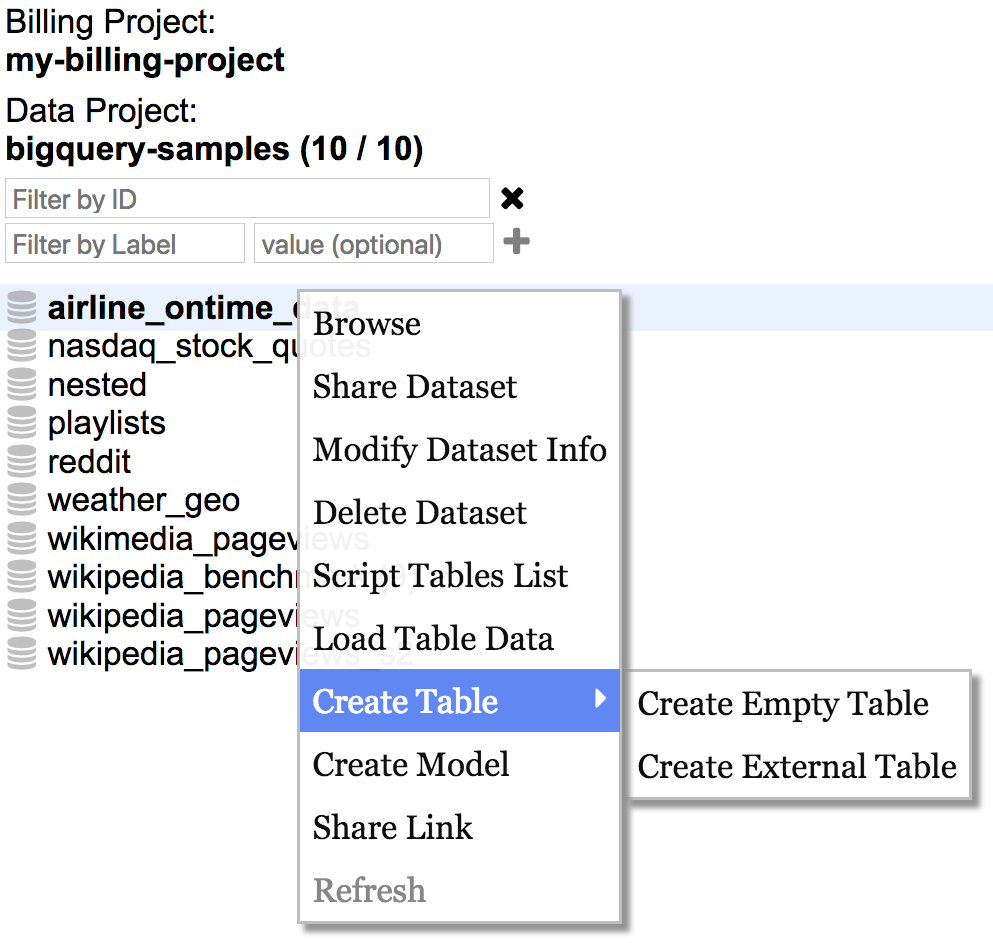
For each node in the navigator (dataset, table, view), there may be available actions. Right-click on a node to view the available actions.
For each node in the navigator, view more info by hovering over it.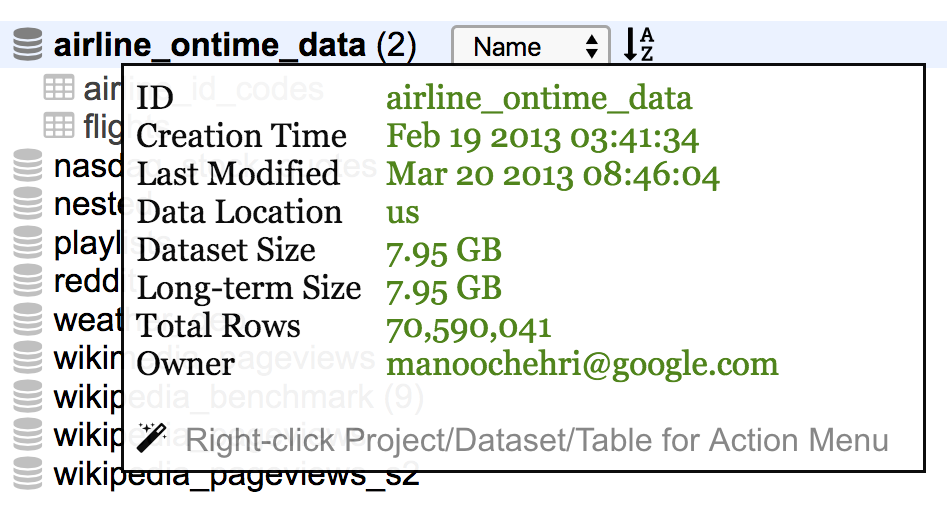
Running Query
As a query is entered or updated, it will be validated and a cost projection will be calculated. The results will be displayed below the query textbox.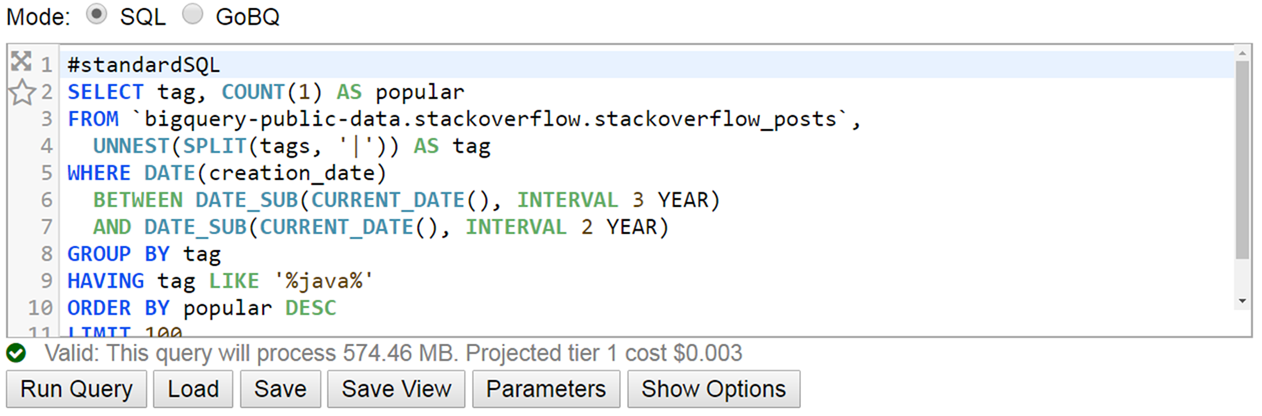
Clicking "Show Options" reveals options for fine tuning how the query is executed.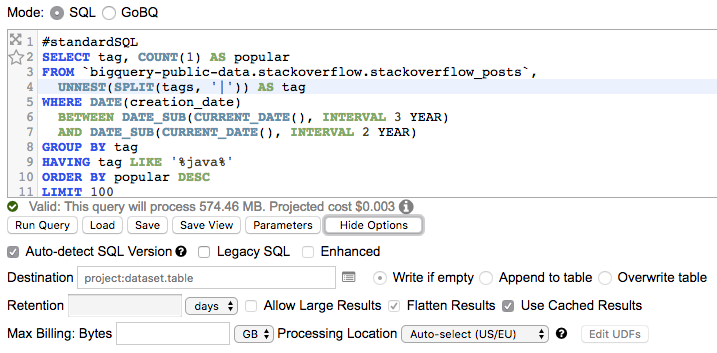
Once a query has finished running, the results are displayed below the query.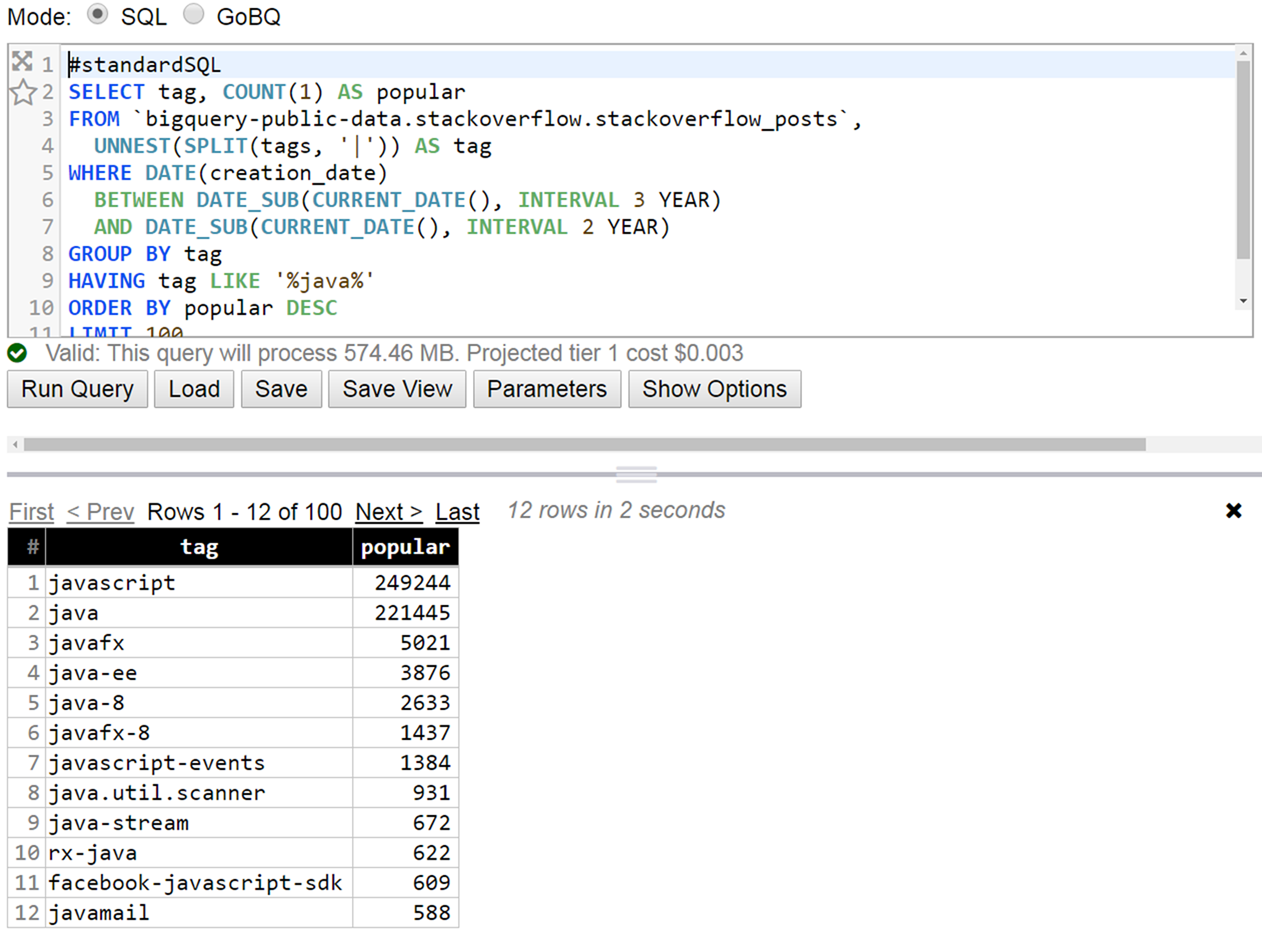
After running a query, use the buttons above the query to take further action on the results. You can download, save as a table, and create charts.
To view further information about the query that has just ran, hover over the "i" icon.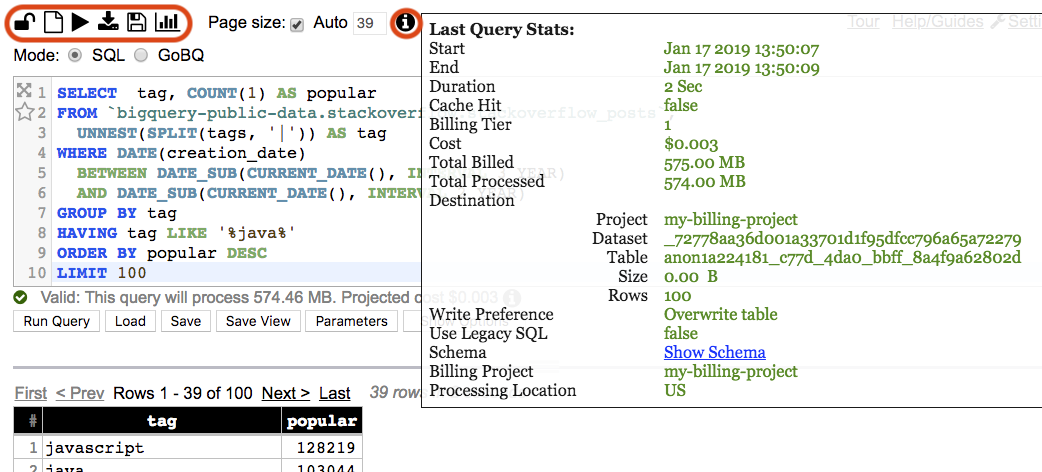
Visualizing Data
Enter visualization mode by clicking the "Pivot/Chart Result" button after running a query.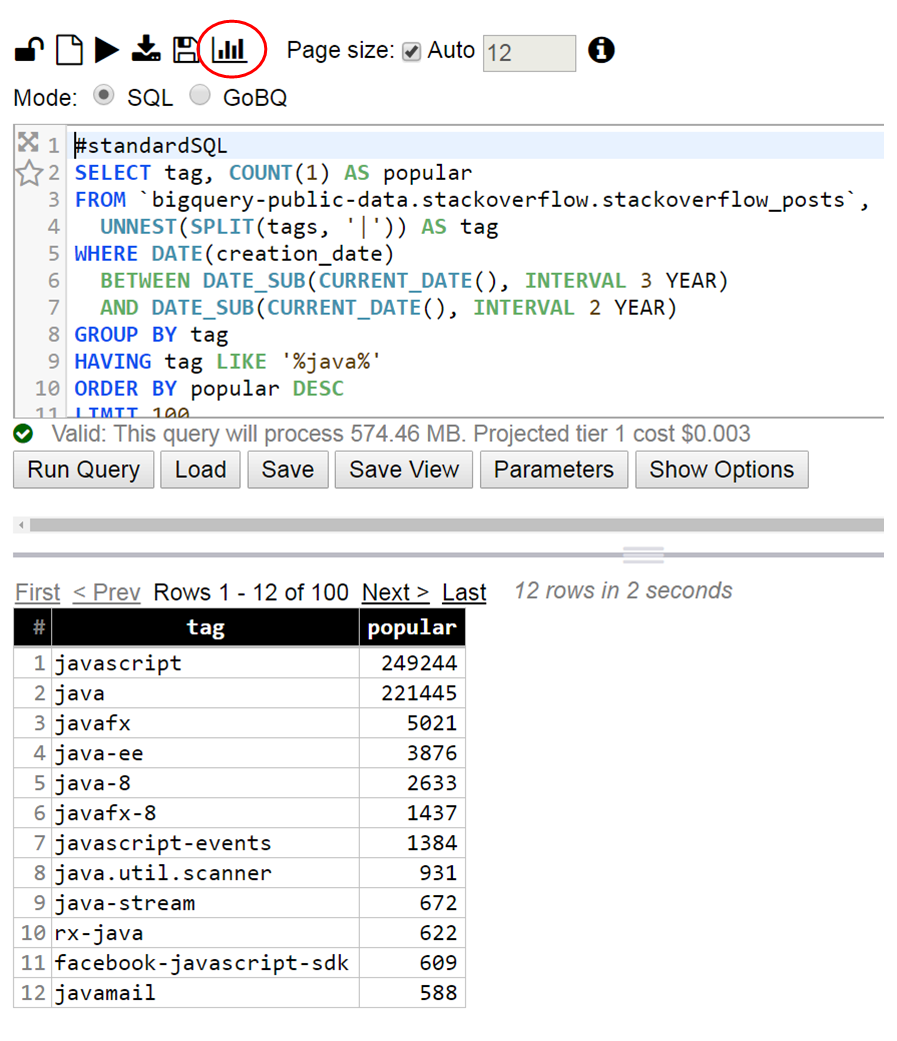
Choose the desired calculation to perform on the data from the secondary drop-down.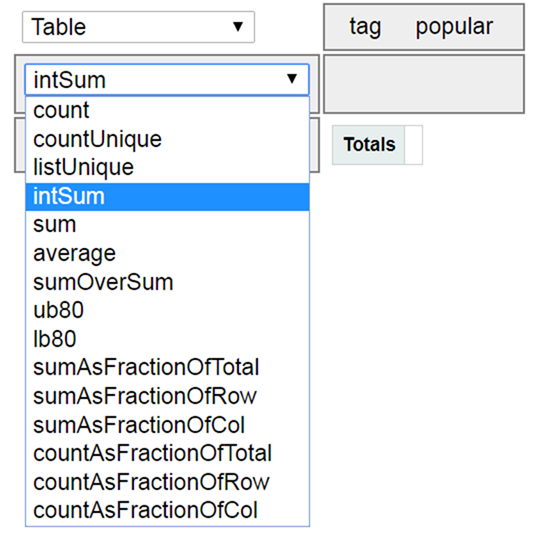
Drag and drop columns to the area below the drop-downs to add them to the chart.
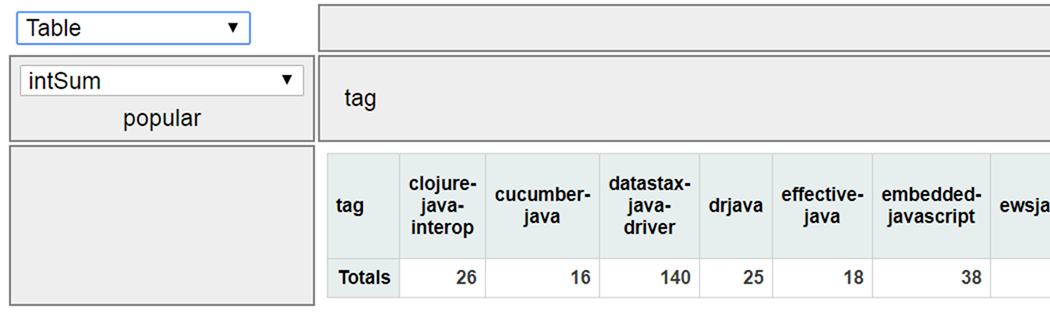
Choose the desired chart type from the drop-down. For example - Area Chart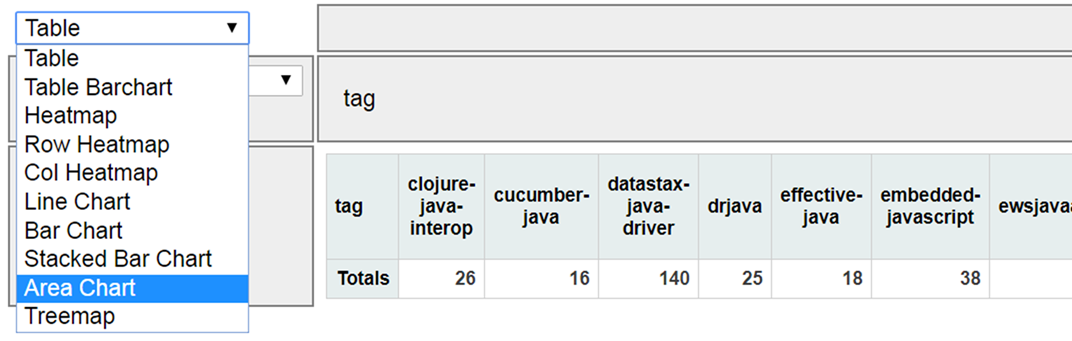
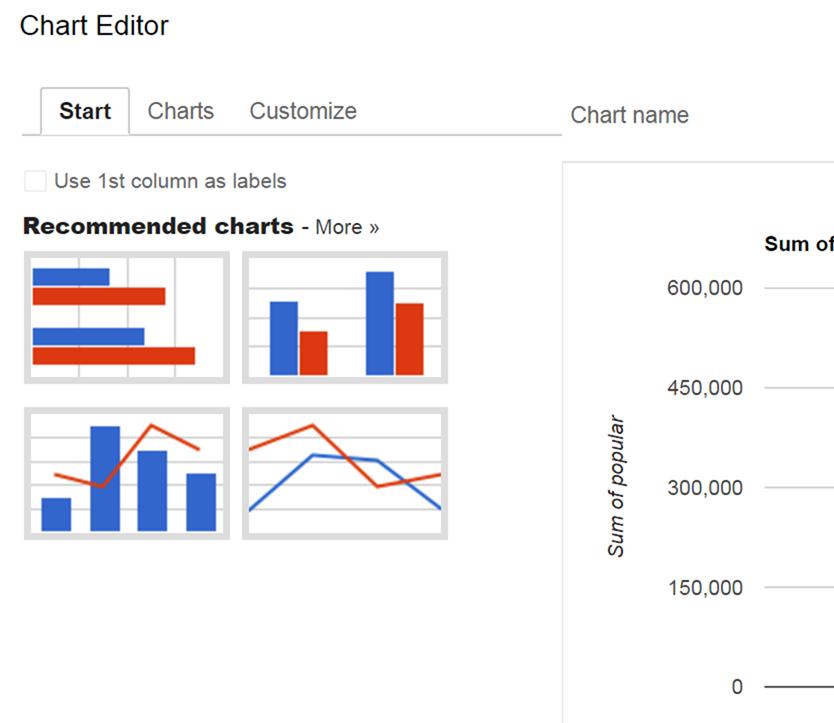
Double click in Chart Area to open Chart Editor
Click "More", choose Pie Chart and click OK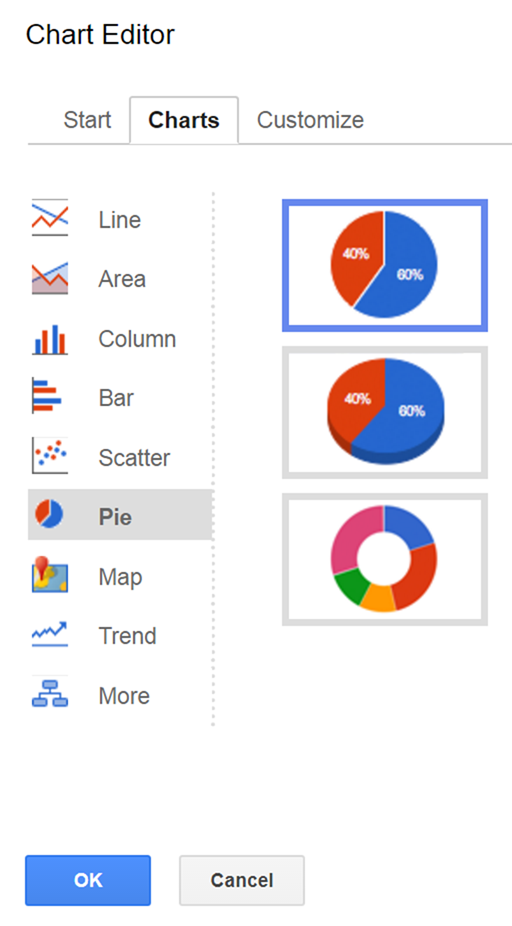
Final Chart will look like below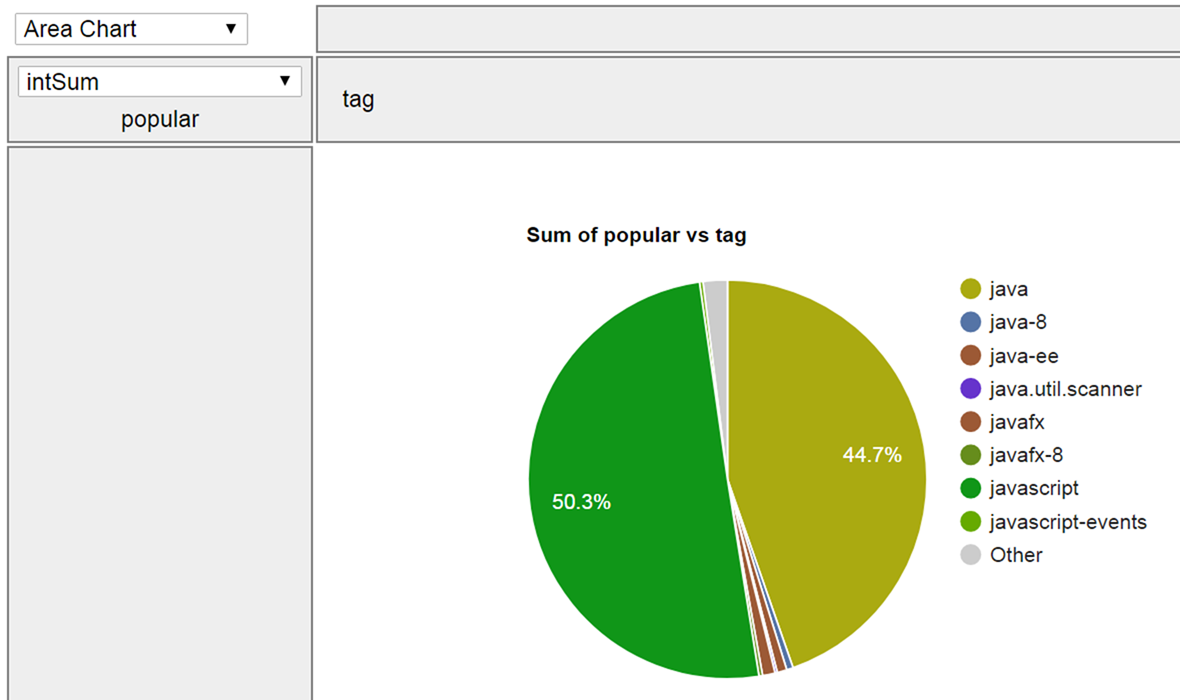
Exploring Metadata
To view project metadata, either left-click on the project name in the navigator, or right-click and choose "Browse" from the contextual menu. This will open the Data Explorer.
Find datasets using the "Filter datasets" textbox. Sort metadata by clicking on the desired column header. View available actions by right-clicking on a dataset. Explore dataset metadata by double-clicking on a dataset or right-clicking on a dataset and choosing "Browse" (also available from the navigator).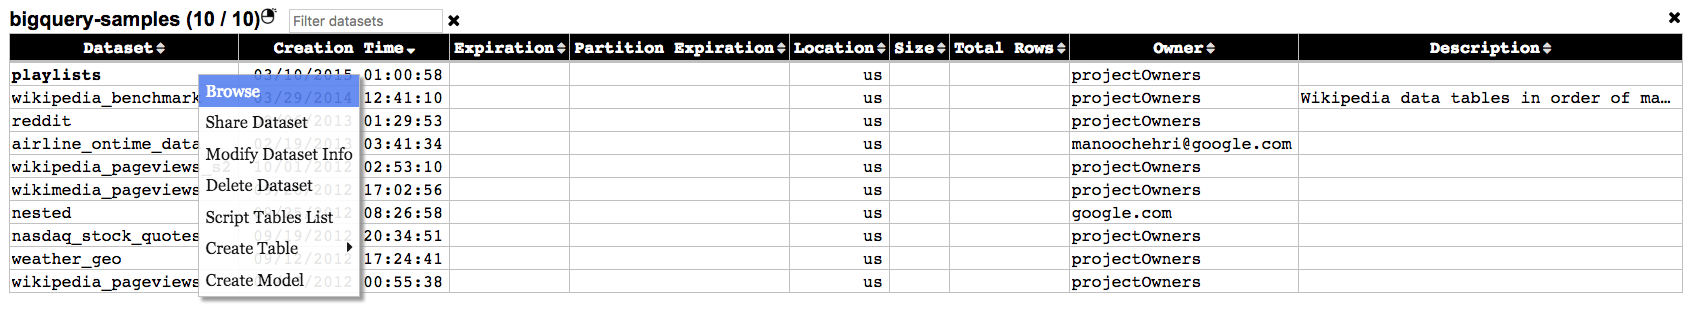
Viewing Recent Jobs
View your recent jobs by right-clicking on the project in the navigator and choosing "Recent Jobs". This will open the Data Explorer.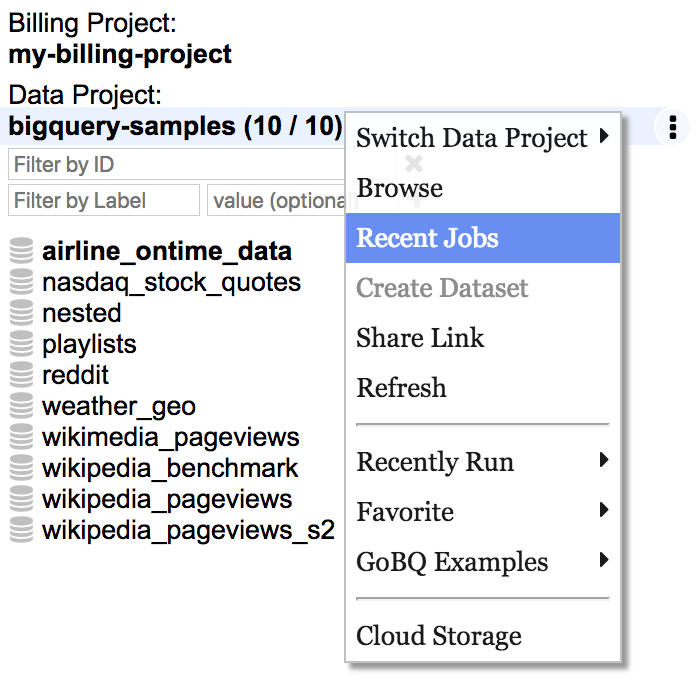
Find a particular job based on query by entering part of the query in the "Filter on query" textbox (only searches jobs currently in the table). View available actions by right clicking on a job row.
See full details of the job by double-clicking on a job row. From here, navigate through jobs using arrow buttons or arrow keys on the keyboard.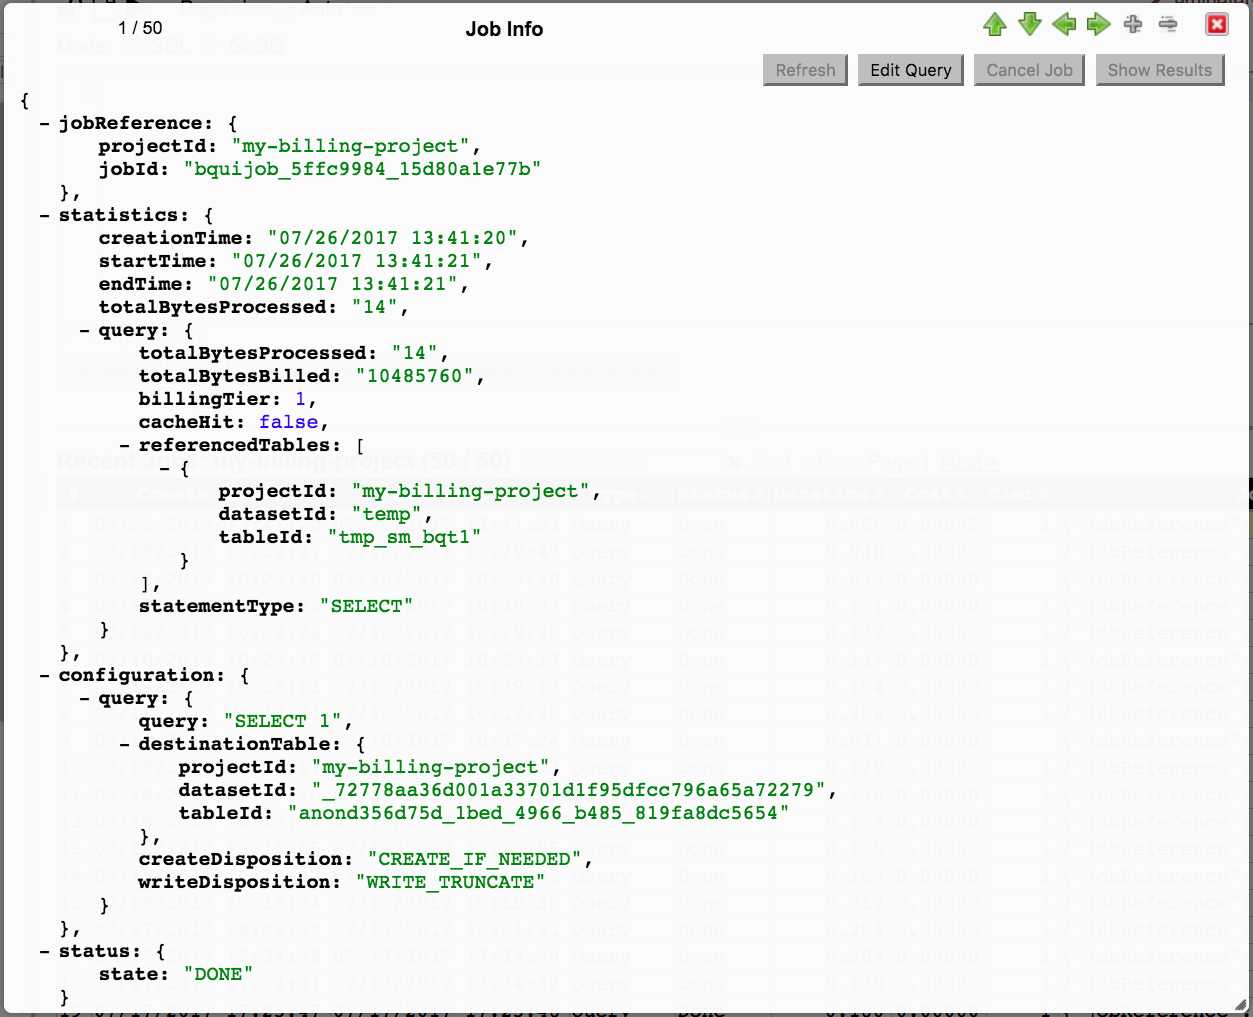
Running Go Scripts
Change to GoBQ mode to run Go scripts.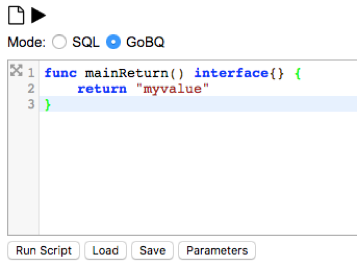
Click "Run Script" to run the Go script. Once the script completes, the results will be displayed below the script. Results are broken down into "Return Value" and "Standard Output".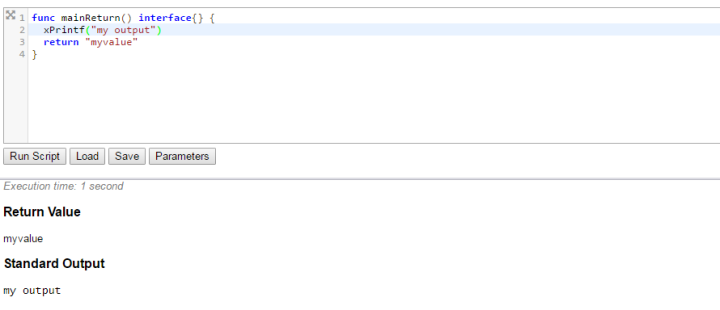
GoBQ Examples are available by right clicking on the project header.
These examples are a starting points and helpers to build robust GoBQ scripts.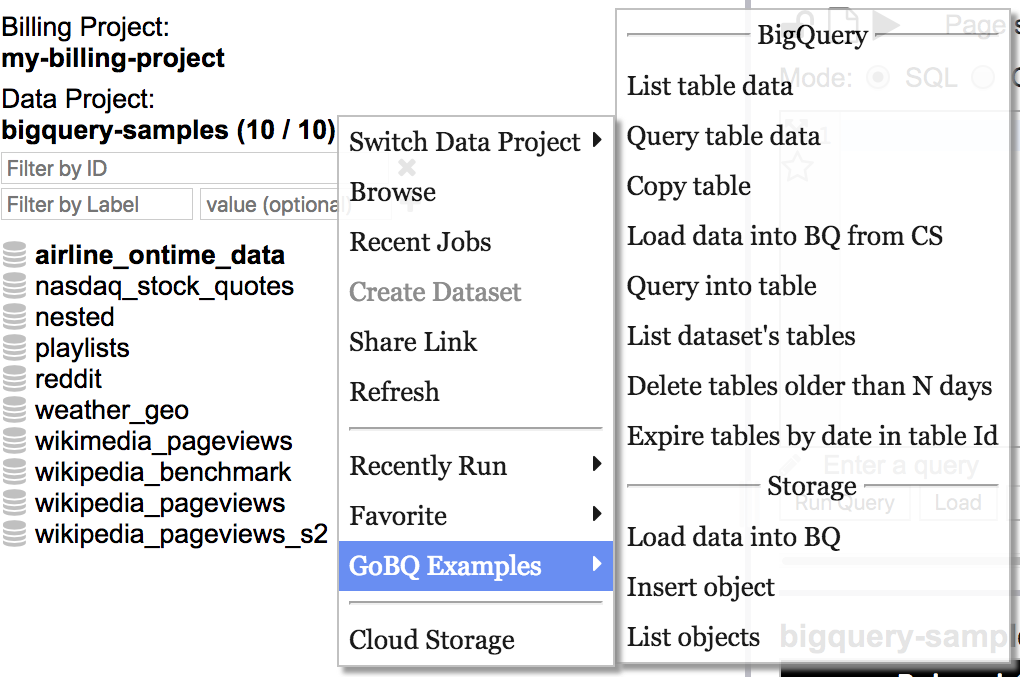
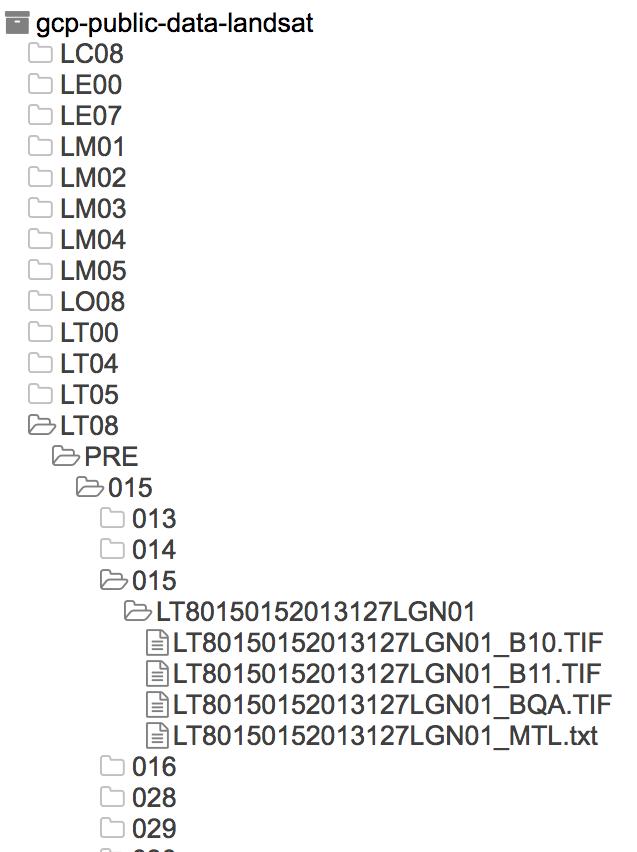
Exploring Cloud Storage
Storage data is presented as buckets, folder, and files. Buckets are top of the hierarchy and contain objects presented as folders and files. Select GCS Storage from the project context menu to display Storage data in the navigator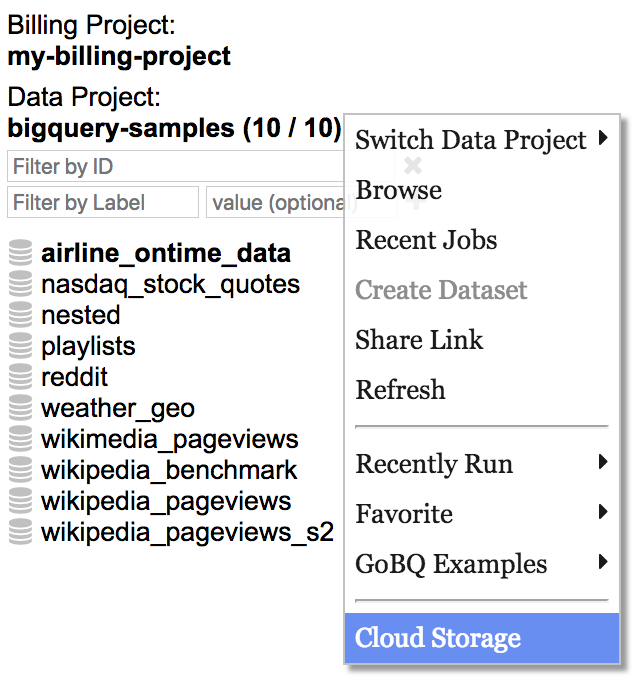
Expand buckets and folders by left-clicking on them