This article provides users with a general guide to the features listed.
These features may have been updated or superseded by additions found in the release notes.
Read the content below to become familiar with the feature and review the release notes to get the latest iteration.
Overview
Goliath features a visualization tool which allows for rich drag and drop analysis of data results
- Data results can be pivoted and displayed in a variety of chart options
- The visualization tool offers a quick drag and drop option for generating columns and rows
- Data can be rendered in several graphs and values can be displayed in many different aggregation types
- Filtering and chart customization are included for fine tuning data display
Below are detailed descriptions of these Goliath features
Pivot/Chart Result
Visualization is available by clicking on Pivot/Chart Result from toolbar
|
|
|
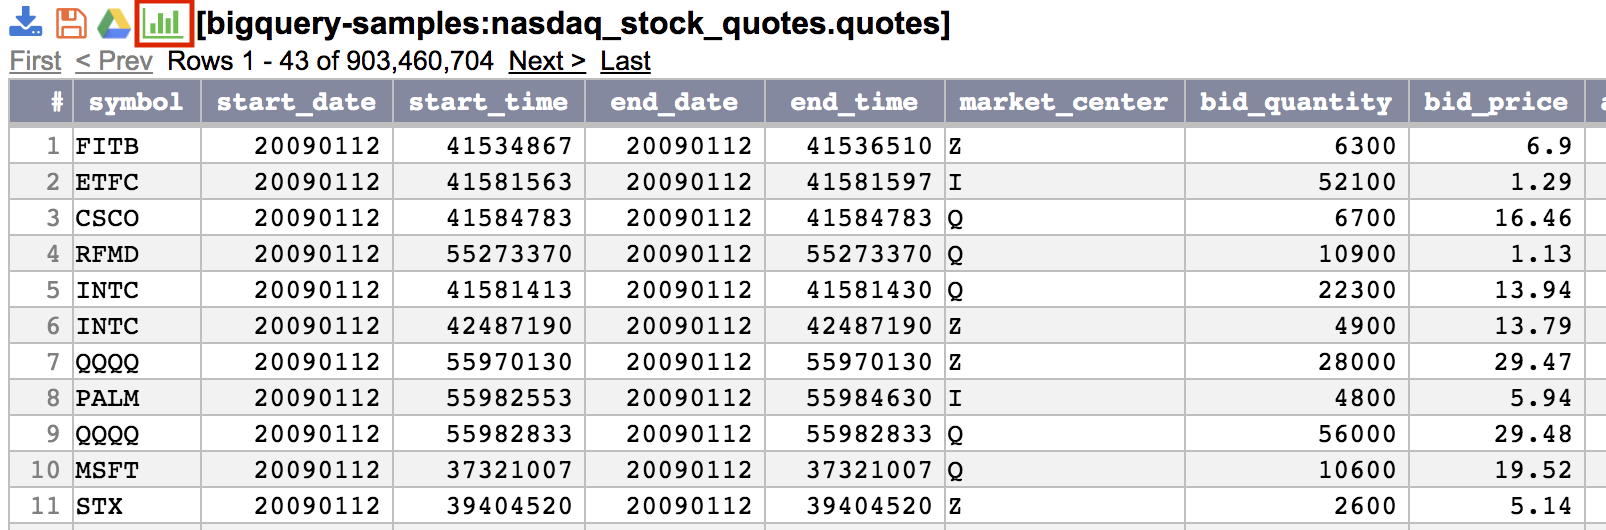
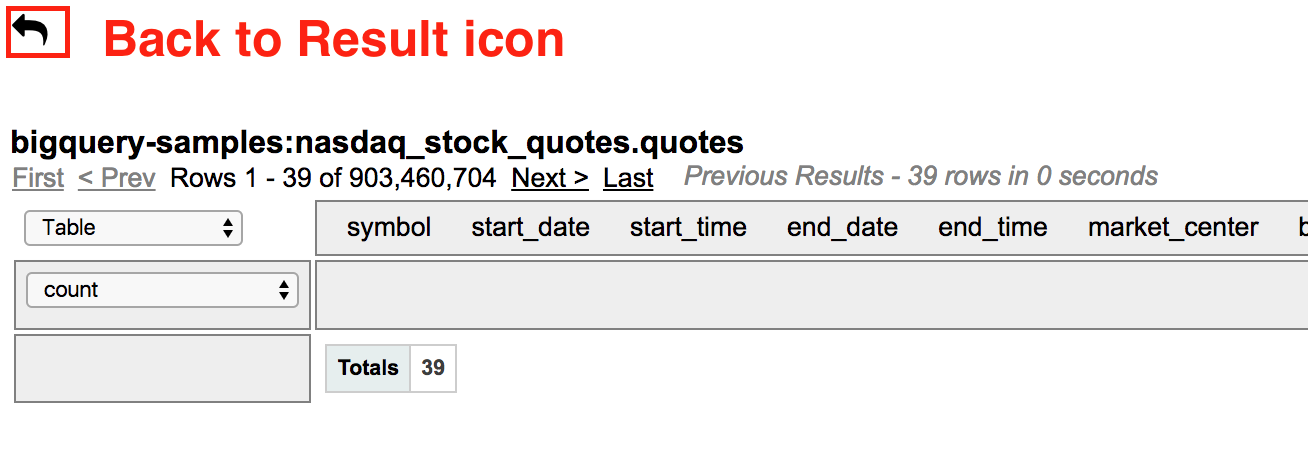
Return to Query results by clicking on Back to Result Icon
Data is paged the same way as query results
 |
|
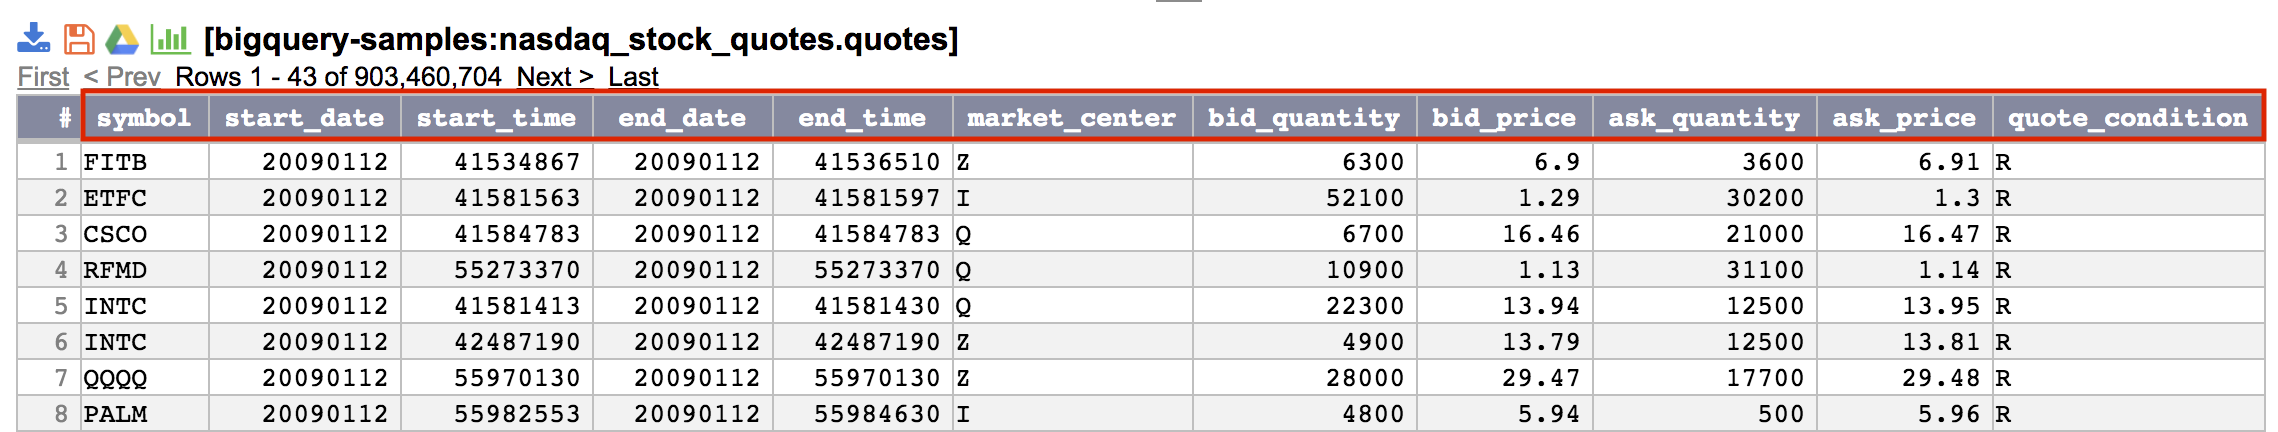
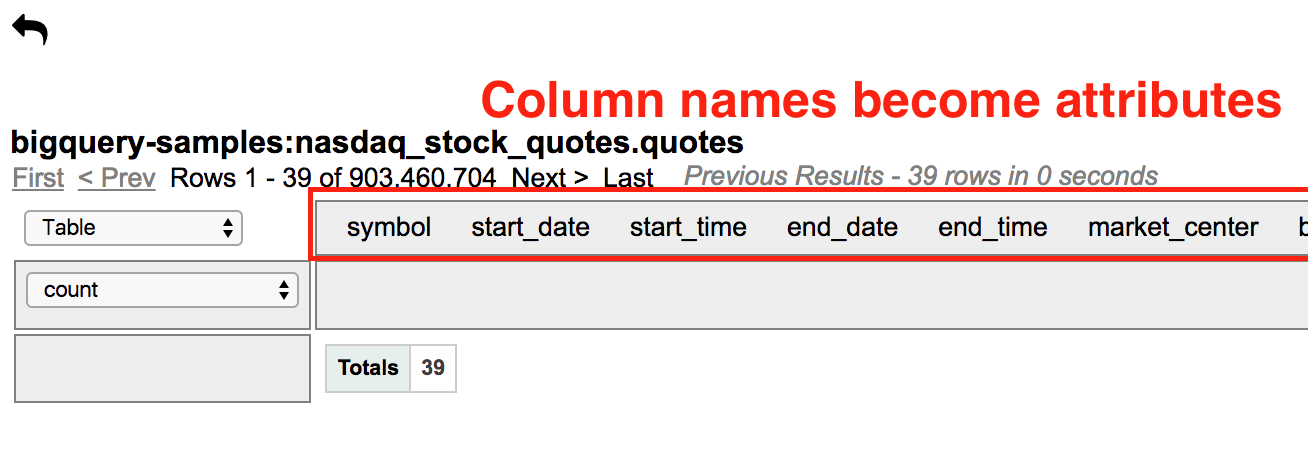
Column names are transformed to attributes in visualization tool
Visualization Editor
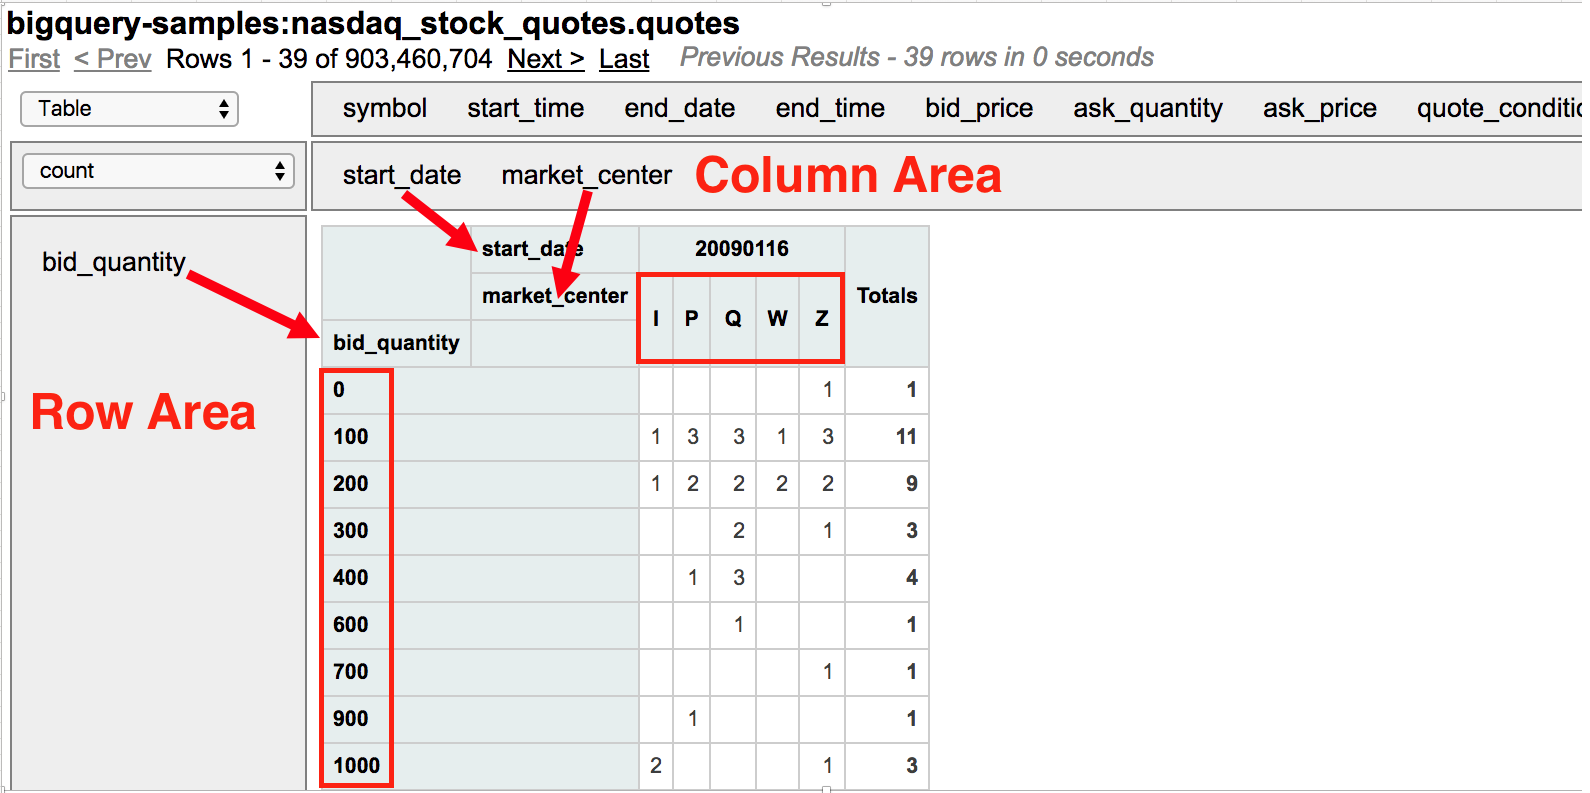 |
Attributes can be used in Column and Row areas Drag and drop an attribute into column or row area These attributes get rendered and represented on a chart |
Rendering
Visualization offers a variety of chart rendering
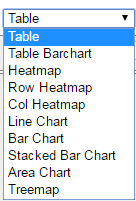
`
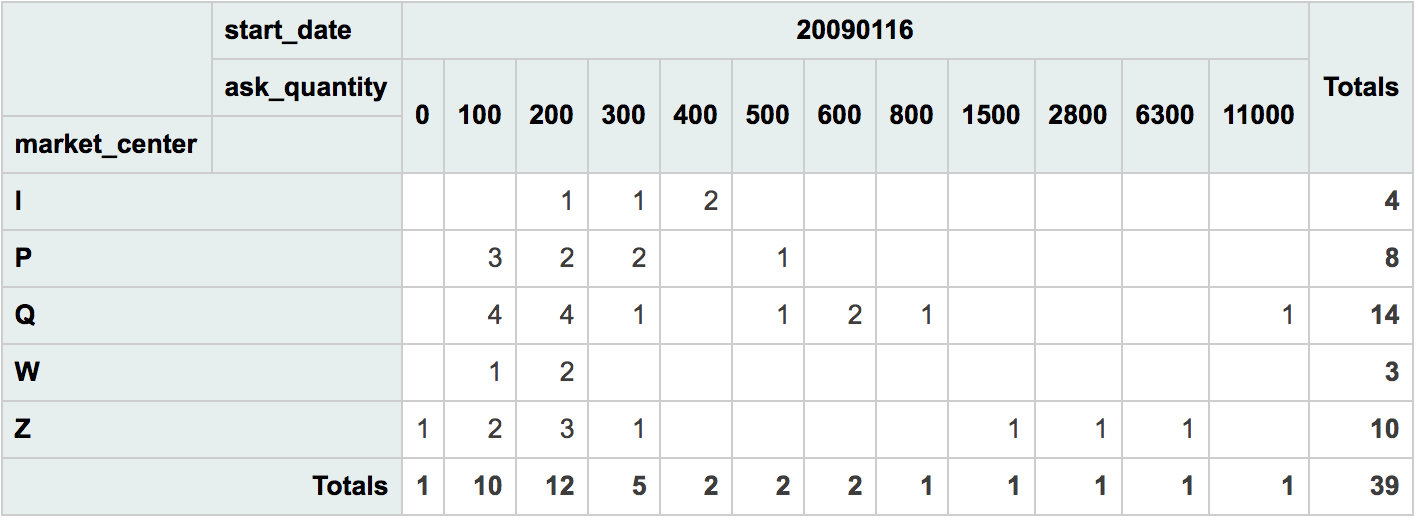
| Table |
Data rendered as a table
|
| Table Barchart |
Data rendered as table and values represented with bar graphs
|
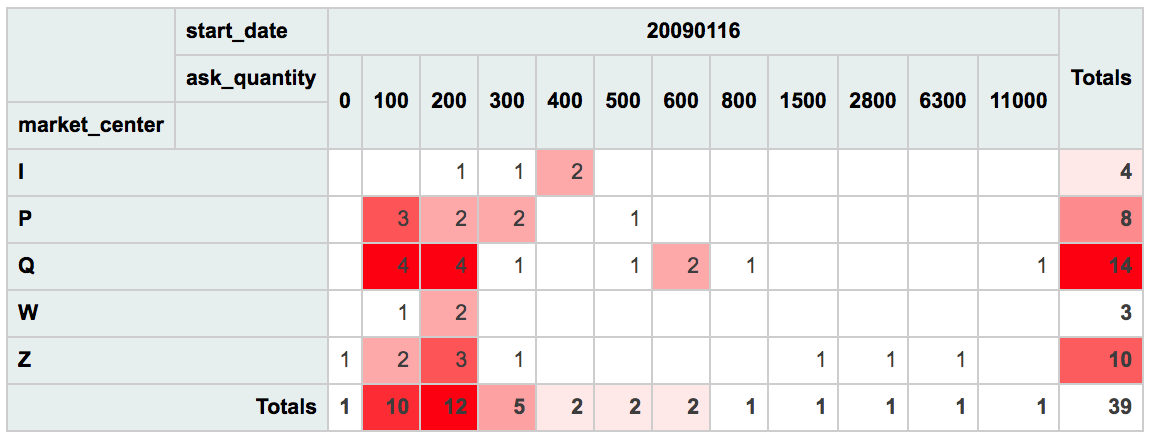
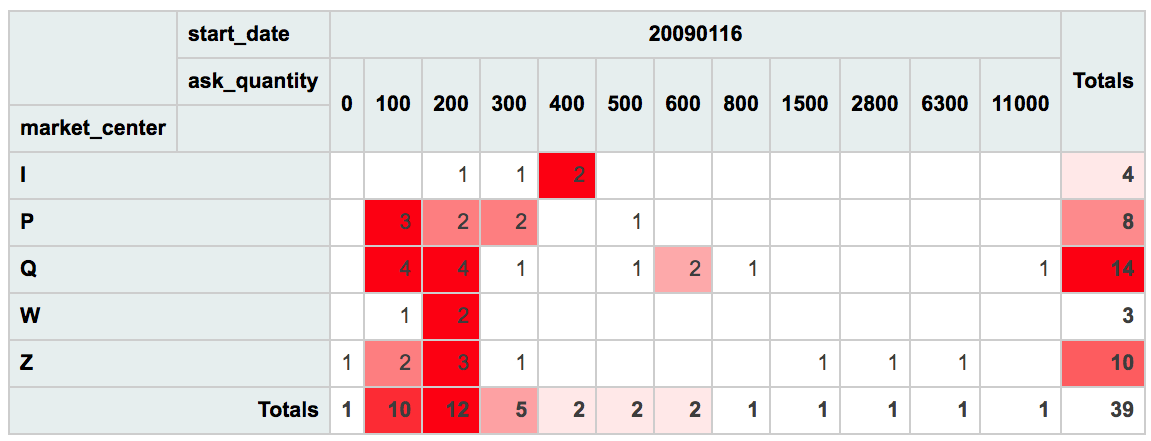
| Heatmap |
Data rendered as table and values represented with degrees of coloring
|
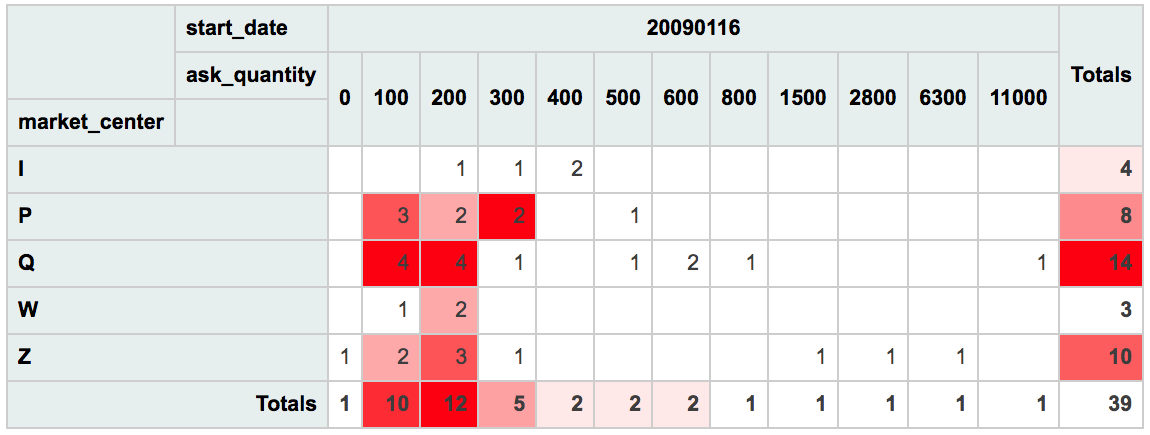
| Row Heatmap |
Data rendered as table and values represented with degrees of coloring based on values within row
|
| Col Heatmap |
Data rendered as table and values represented with degrees of coloring based on values within column
|
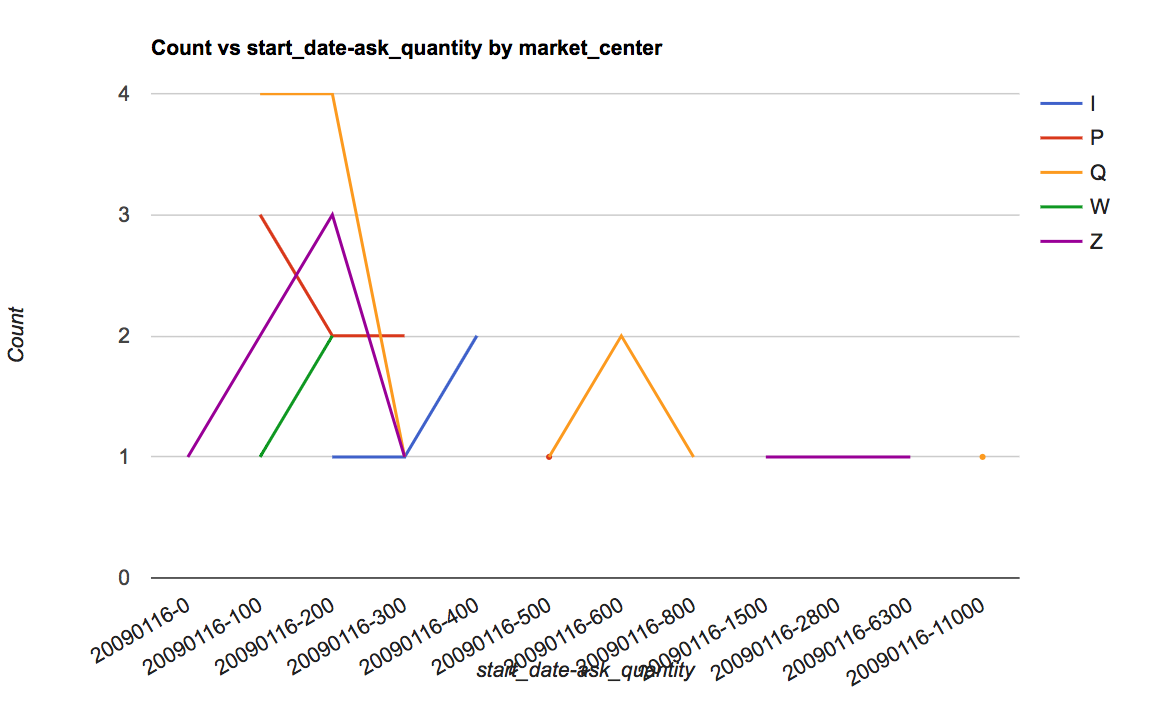
| Line Chart |
Data rendered as chart where values are represented by lines
|
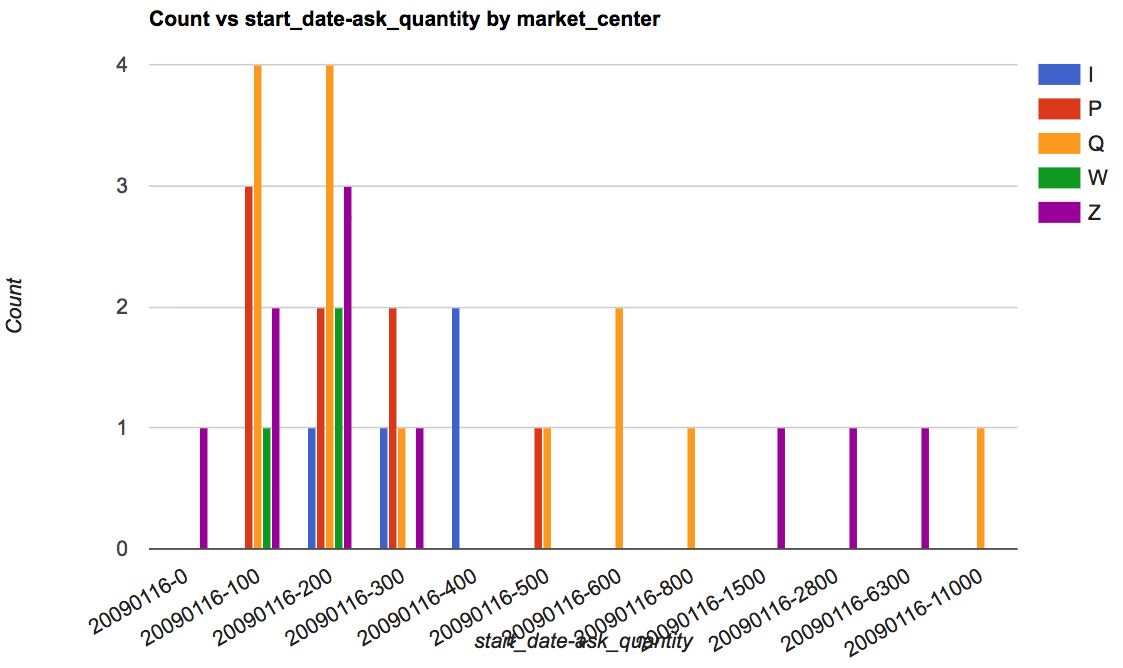
| Bar Chart |
Data rendered as chart where values are represented by bars
|
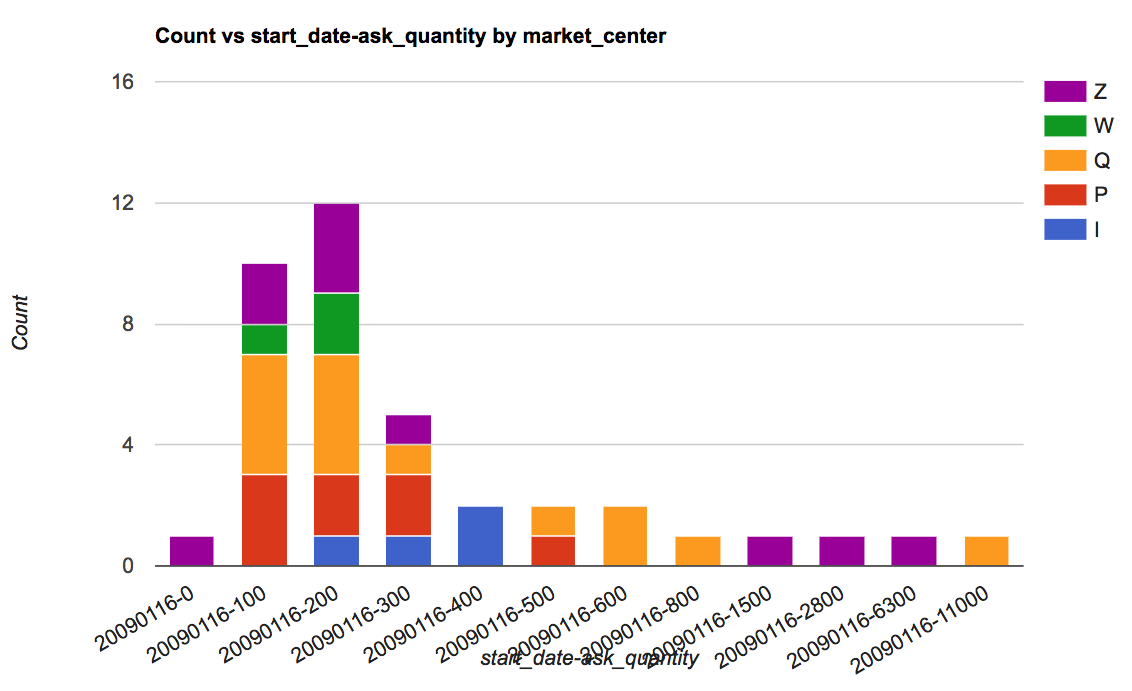
| Stacked Bar Chart |
Data rendered as chart where values are represented within a single bar
|
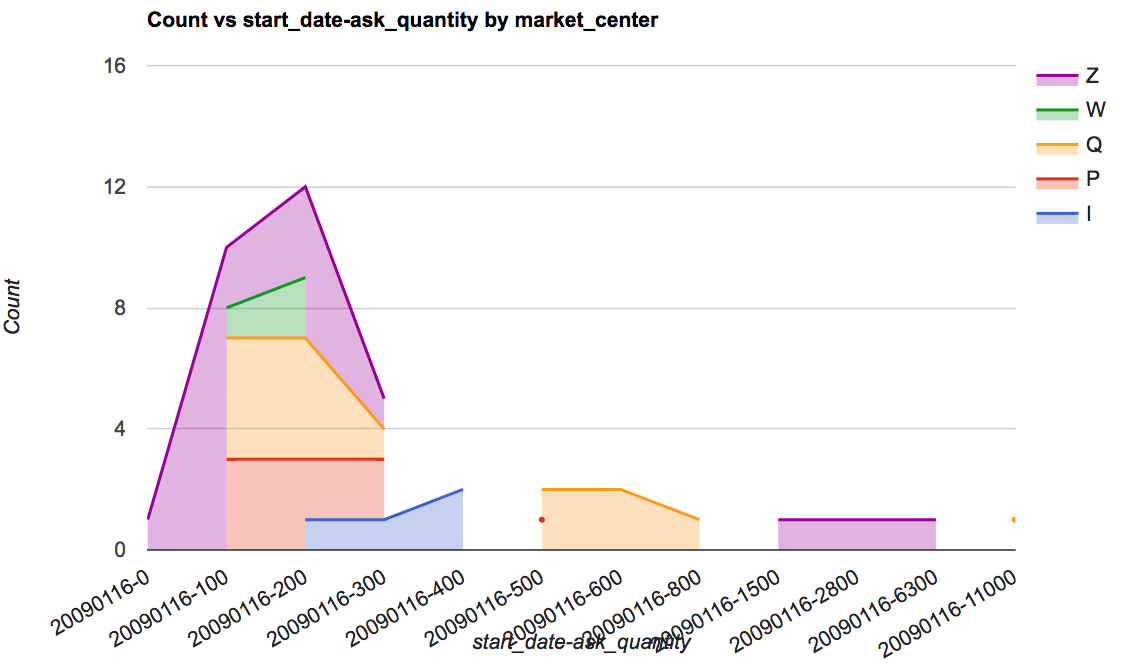
| Area Chart |
Data rendered as chart where values are represented as areas of chart
|
| Treemap | Data rendered as chart where values are represented as nested rectangles |

Aggregators
Visualization offers a variety of aggregators
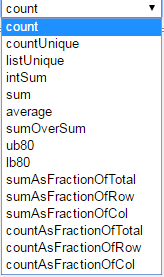
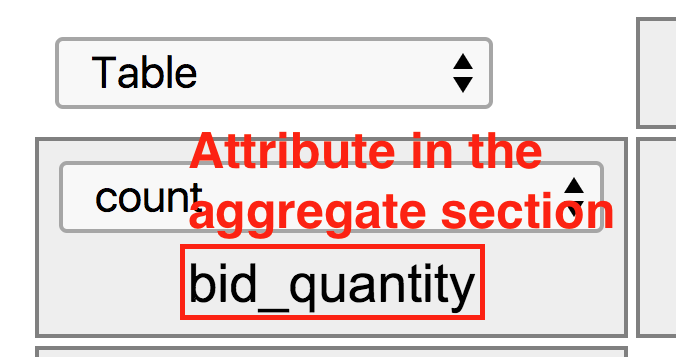 |
To aggregate by an attribute drag the attribute to the aggregate section |
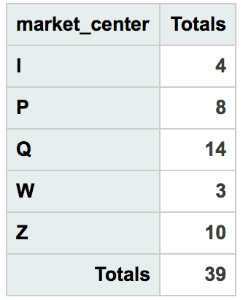
| Count |
Counts the number of instances of aggregated attribute
|
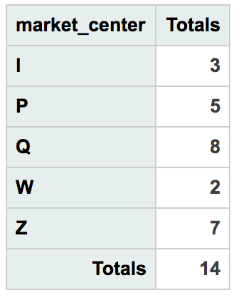
| countUnique |
Counts the number of unique instances of aggregated attribute
|
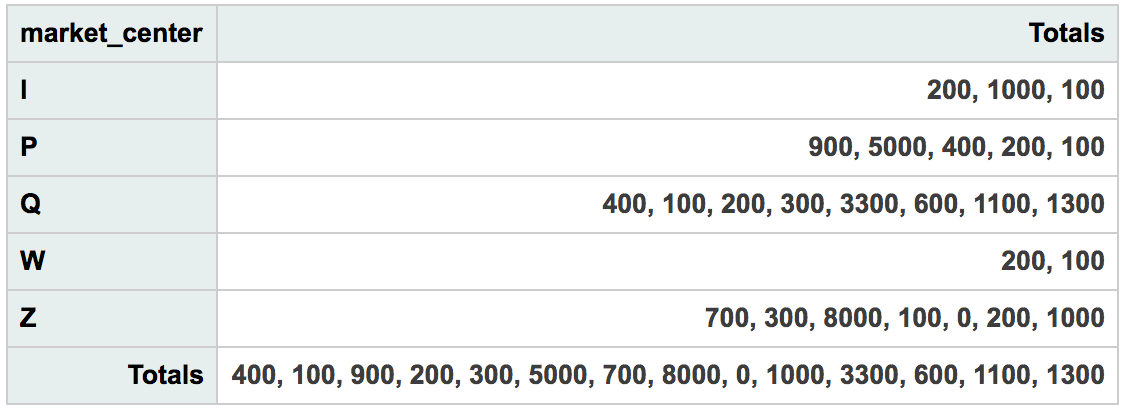
| listUnique |
A list of unique instances of aggregated attribute
|
| intSum |
Sum of aggregated attribute values cast as integer
|
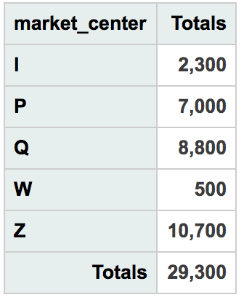
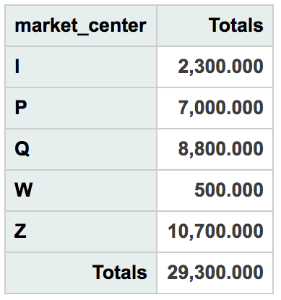
| Sum |
Sum of aggregated attribute values
|
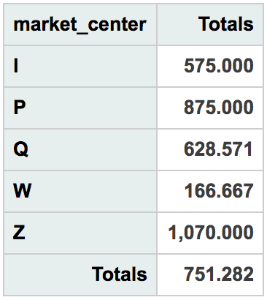
| Average |
Average of aggregated attribute values
|
| SumOverSum | The sum of an aggregated attribute divided by the sum of another aggregated attribute |
| Ub80 | 80% Upper Bound of two aggregated attributes |
| Lb80 | 80% Lower Bound of two aggregated attributes |
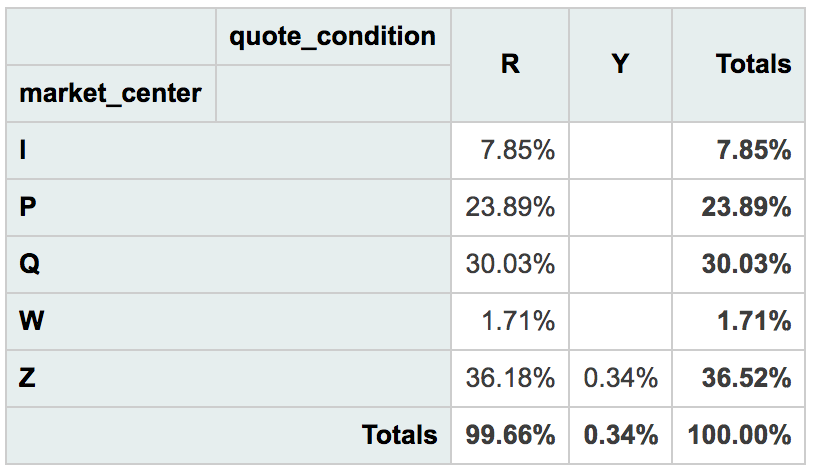
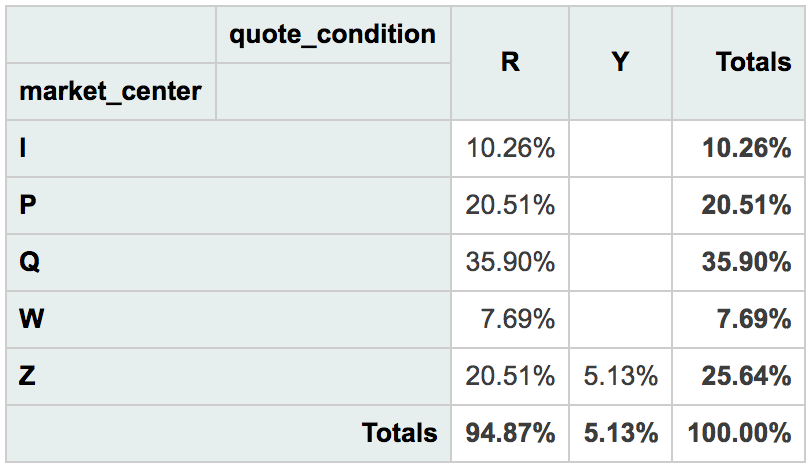
| sumAsFractionOfTotal |
Percentage Sum of aggregated attribute per row divided by the total sum of aggregated attribute across all rows/columns
|
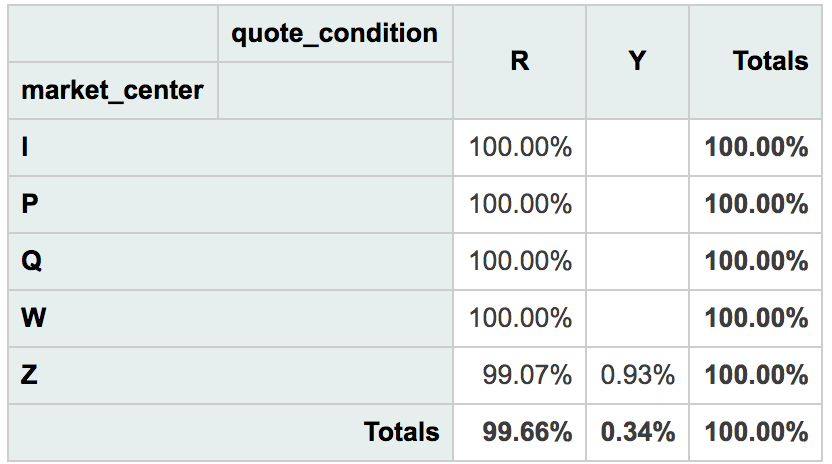
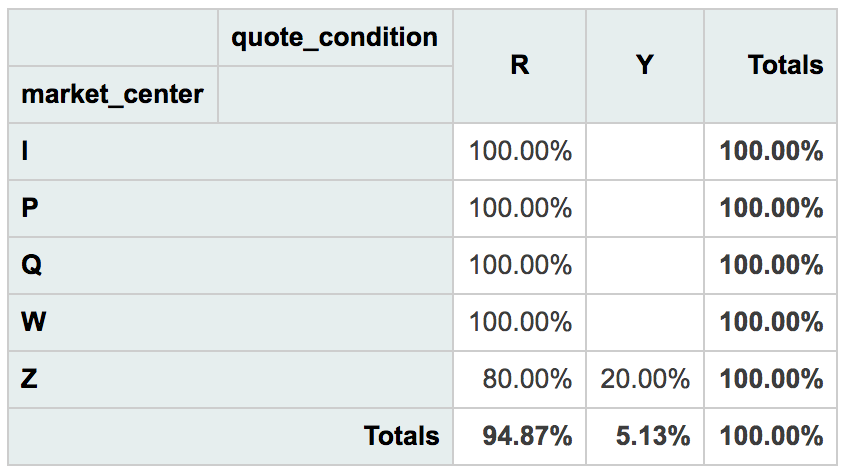
| sumAsFractionOfRow |
Percentage Sum of aggregated attribute per row divided by the total sum of aggregated attribute across all columns
|
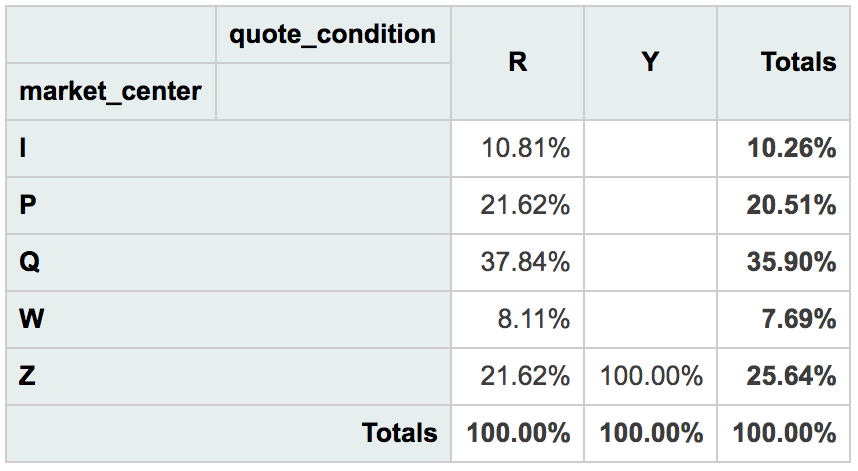
| sumAsFractionOfCol |
Percentage Sum of aggregated attribute per row divided by the total sum of aggregated attribute across all rows
|
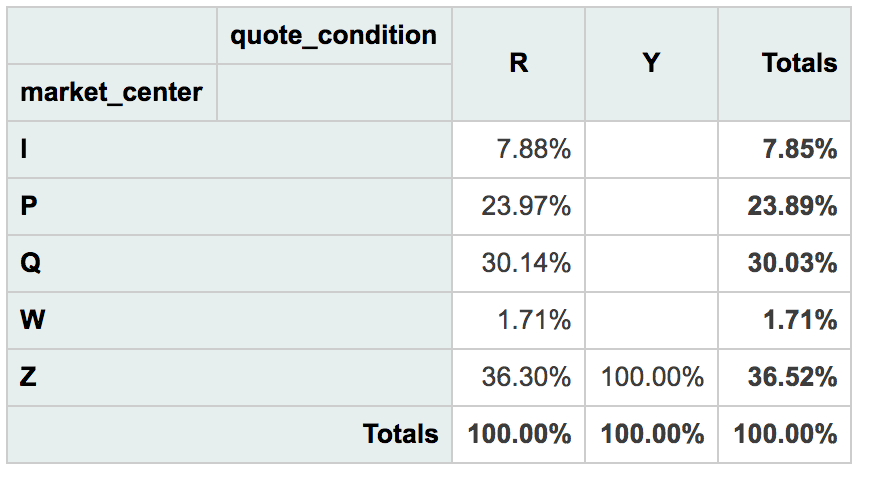
| countAsFractionOfTotal |
Percentage Count of aggregated attribute per row divided by the total count of aggregated attribute across all rows/columns
|
| countAsFractionOfRow |
Percentage Count of aggregated attribute per row divided by the total count of aggregated attribute across all columns
|
| countAsFractionOfCol |
Percentage Count of aggregated attribute per row divided by the total count of aggregated attribute across all rows
|
Filtering
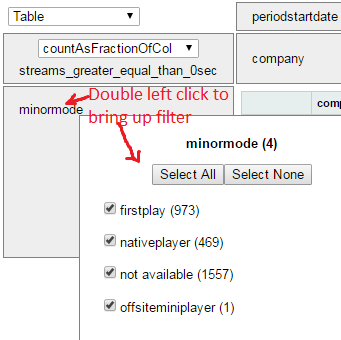 |
Double left clicking on any attribute will open a list that can be filtered |
Chart Editor
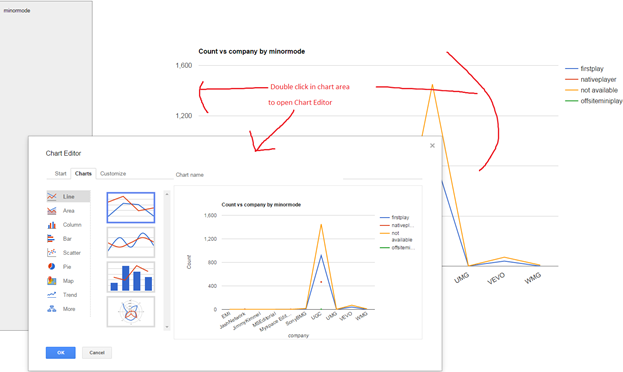 |
For chart rendering double click in chart area to bring up chart editor |
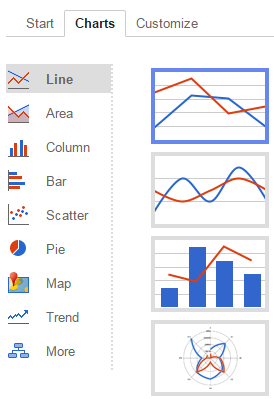 |
Available charts include
|
 |
Charts can be customized Customization includes
|