This article provides users with a general guide to the features listed.
These features may have been updated or superseded by additions found in the release notes.
Read the content below to become familiar with the feature and review the release notes to get the latest iteration.
Overview
Running queries is a primary focus in Goliath
Goliath presents many features to easily and quickly run a query in any SQL mode and to navigate a tables data (Preview)
Below are steps on how to run a query
How to Run SQL Query
In Normal mode, queries return results as it is in Google Web UI - flatten results for Legacy SQL
1. Set mode to SQL![]()
2. In text area write SQL
a. Rich text editor
When typing keywords such as SELECT begin typing and then CTRL+SPACE to bring up auto-fill drop down or to autocomplete

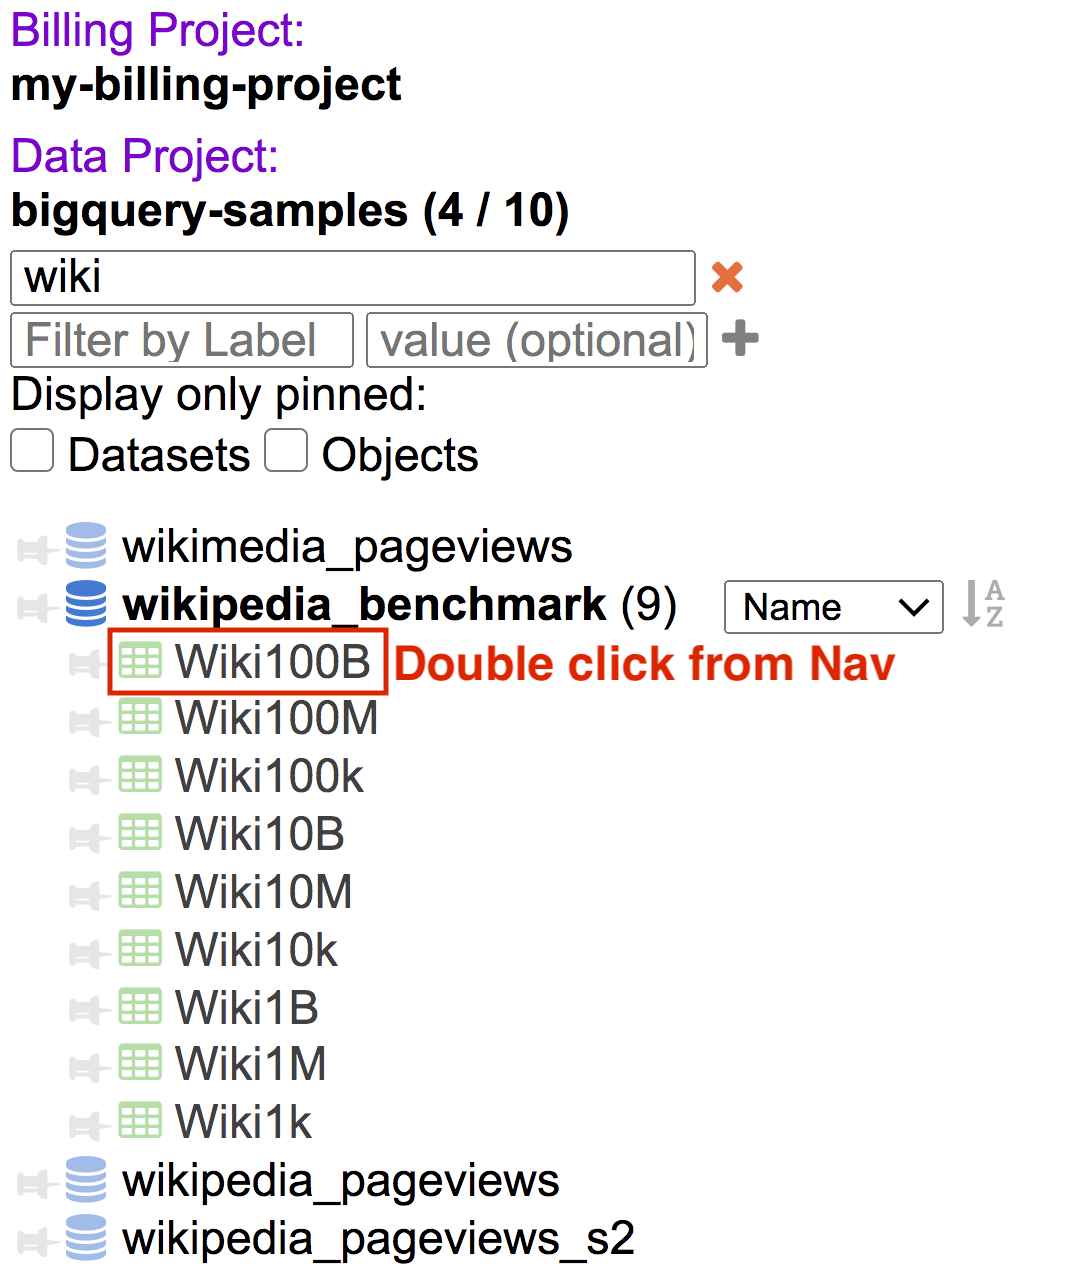
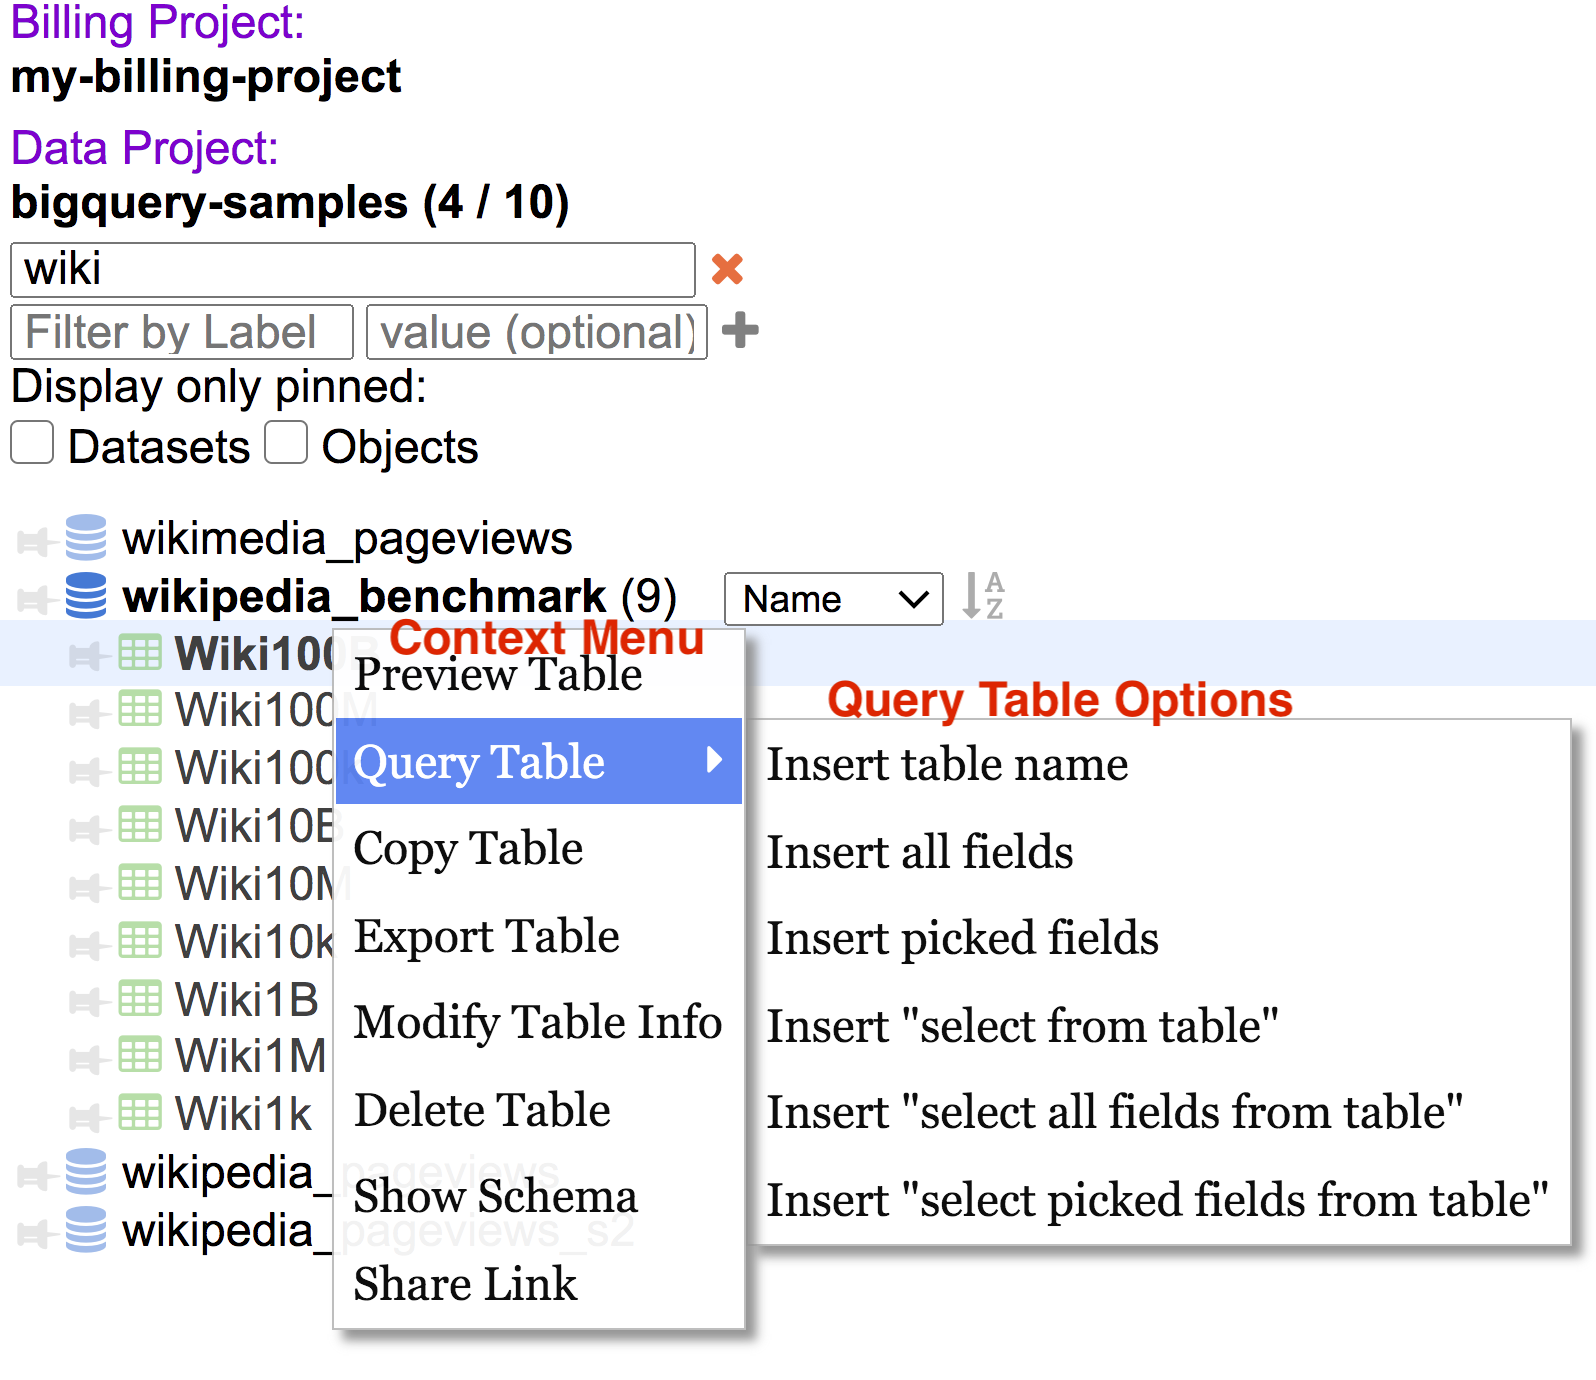
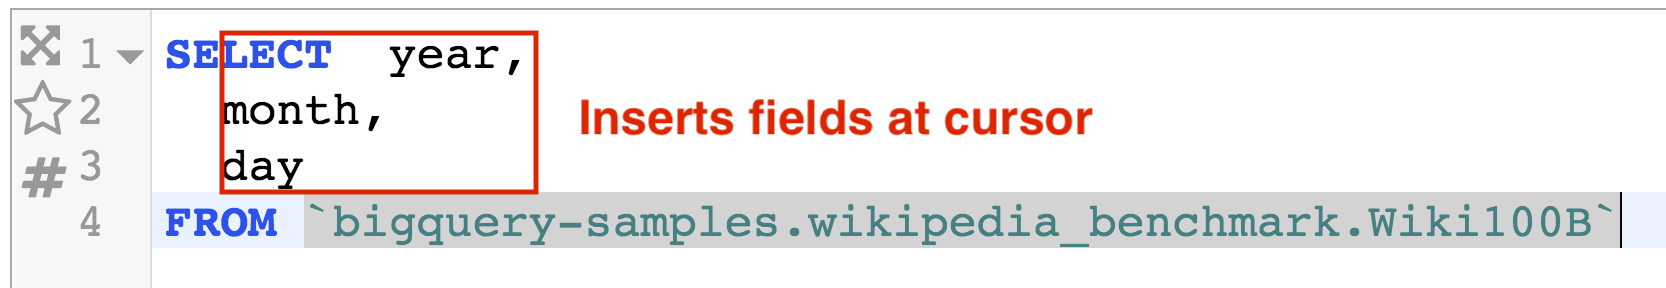
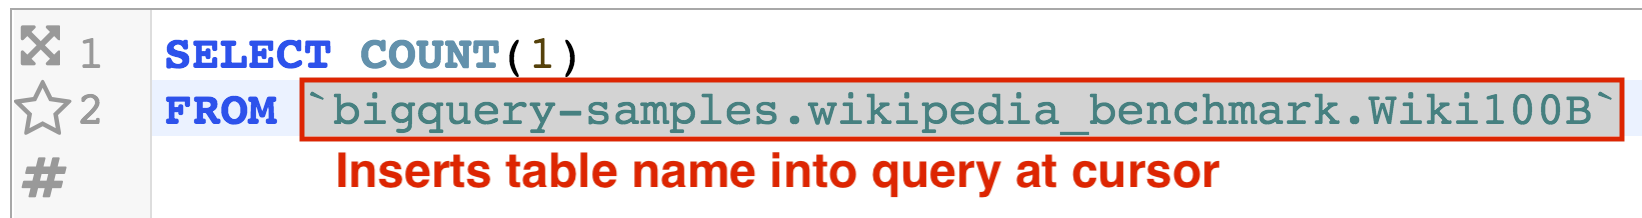
b. Insert table to query
Double click table name from Nav or dataset browser to insert table into query area at cursor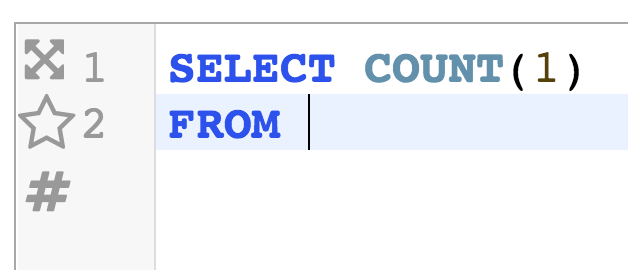

c. Table Context Menu: Query Table options
Query table options provide a short cut for inserting or scripting columns and table into query text area. Right click on table or left click on more options menu icon to bring up context menu and from menu select Query Table and one of the available query table options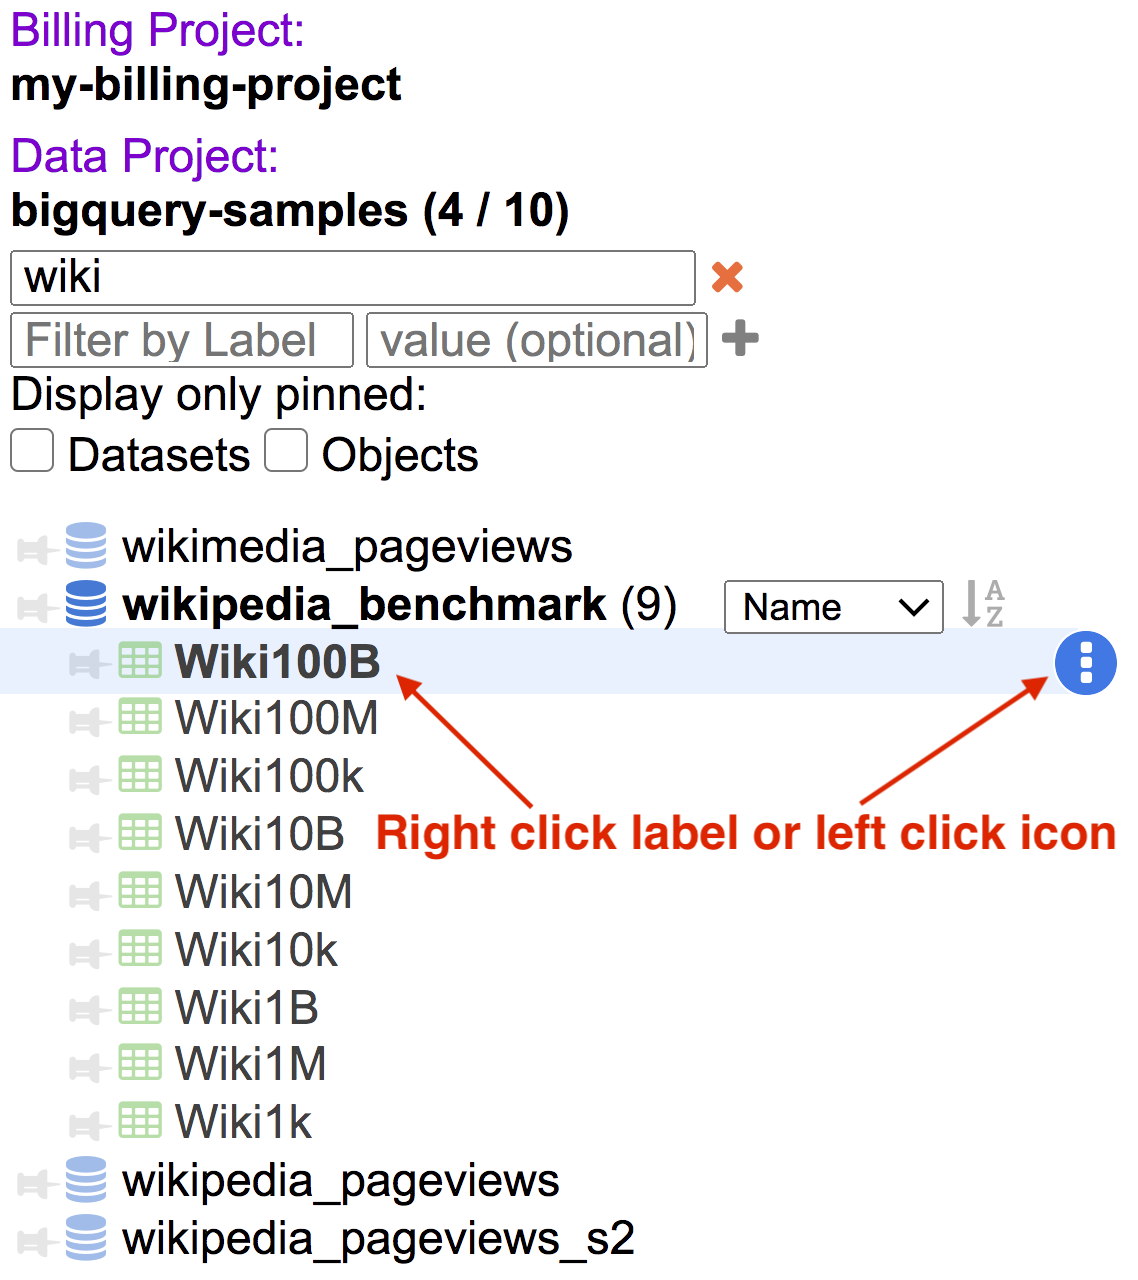

3. Check query status
An error is indicated by an exclamation icon along with red text. If an error is displayed read error message and correct accordingly
If query is valid a check icon along with green text is displayed along with the amount of data to be processed, projected tier, and cost of query
4. Click Run Query button to submit query
A query is running notification will display. The processing time will be displayed as duration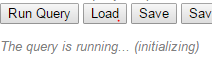
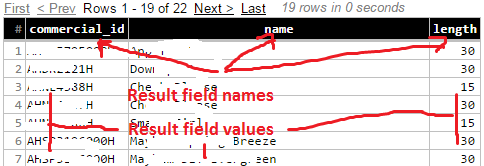
5. Results are displayed in a table in the results panel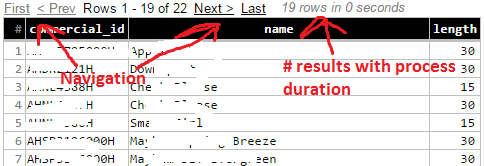

How to Run SQL Query with Enhanced option
Enhanced mode is used when returning columns with record data type
This mode addresses limitation of Google Web UI for Legacy SQL
1. Set mode SQL![]()
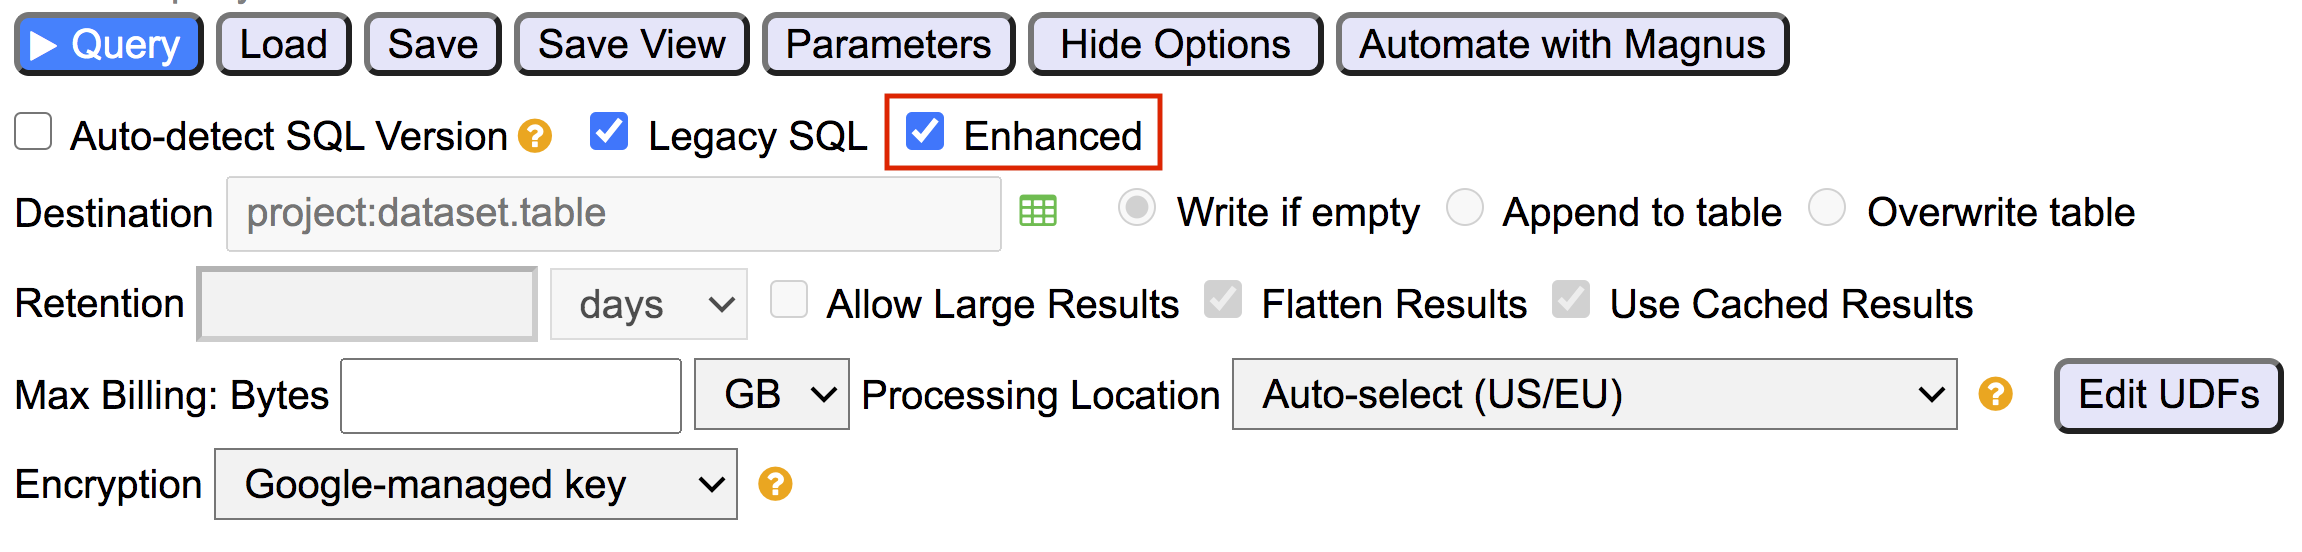
2. Expand Options and check Enhanced. Enhanced option is available when Auto-detect SQL Version is unchecked and Legacy SQL is checked.
3. In text area write SQL
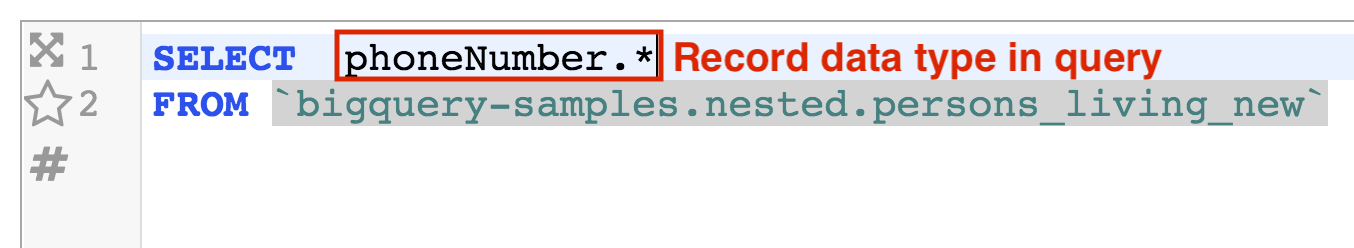
a. Record columns are represented as columnname.*. Using asterick (*) will return all records for specified column.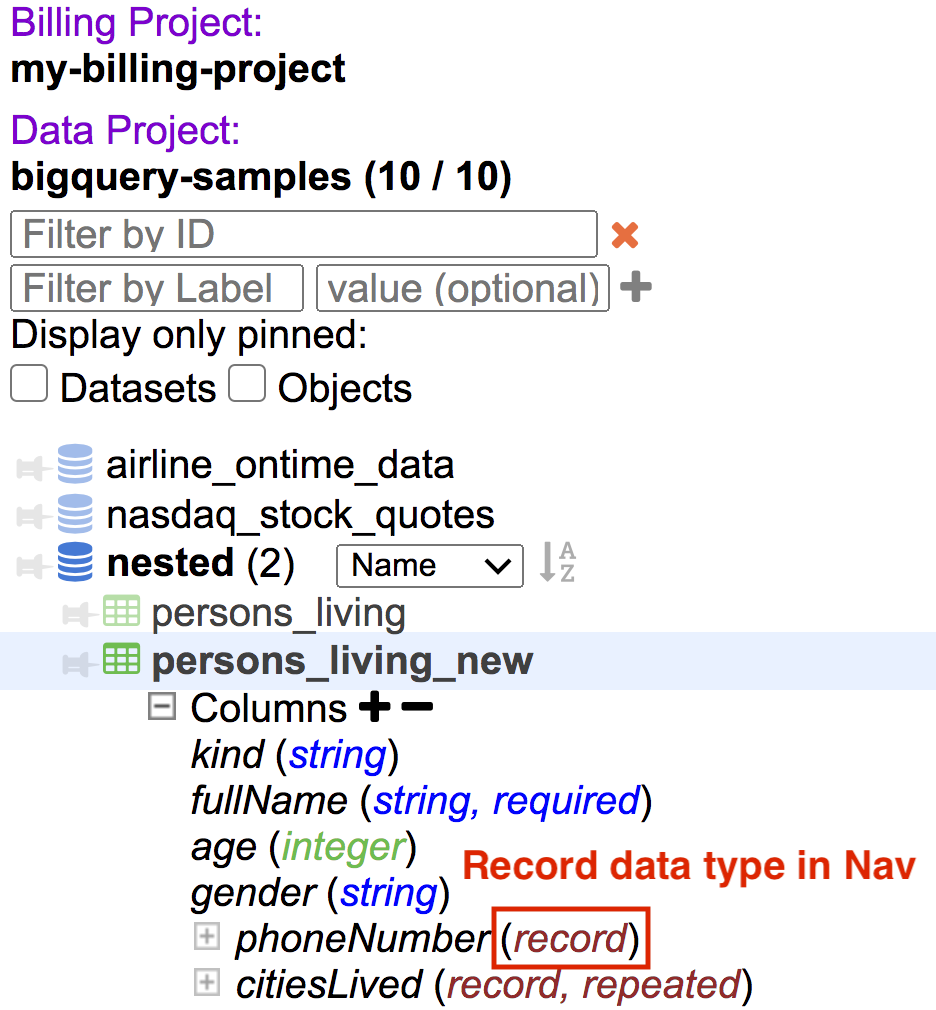
b. Rich text editor
When typing keywords such as SELECT begin typing and then CTRL+SPACE to bring up auto-fill drop down or to autocomplete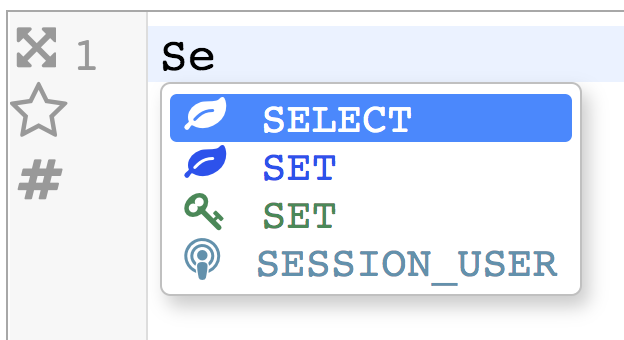
c. Insert table to query
Double click table name from Nav or dataset browser to insert table into query area at cursor


d. Table Context Menu: Query Table options
Query table options provide a short cut for inserting or scripting columns and table into query text area. Right click on table or left click on more options menu icon to bring up context menu and from menu select Query Table and one of the available query table options


4. Check query status
An error is indicated by an exclamation icon along with red text. If an error is displayed read error message and correct accordingly
If query is valid a check icon along with green text is displayed along with the amount of data to be processed, projected tier, and cost of query
5. Click Run Query button to submit query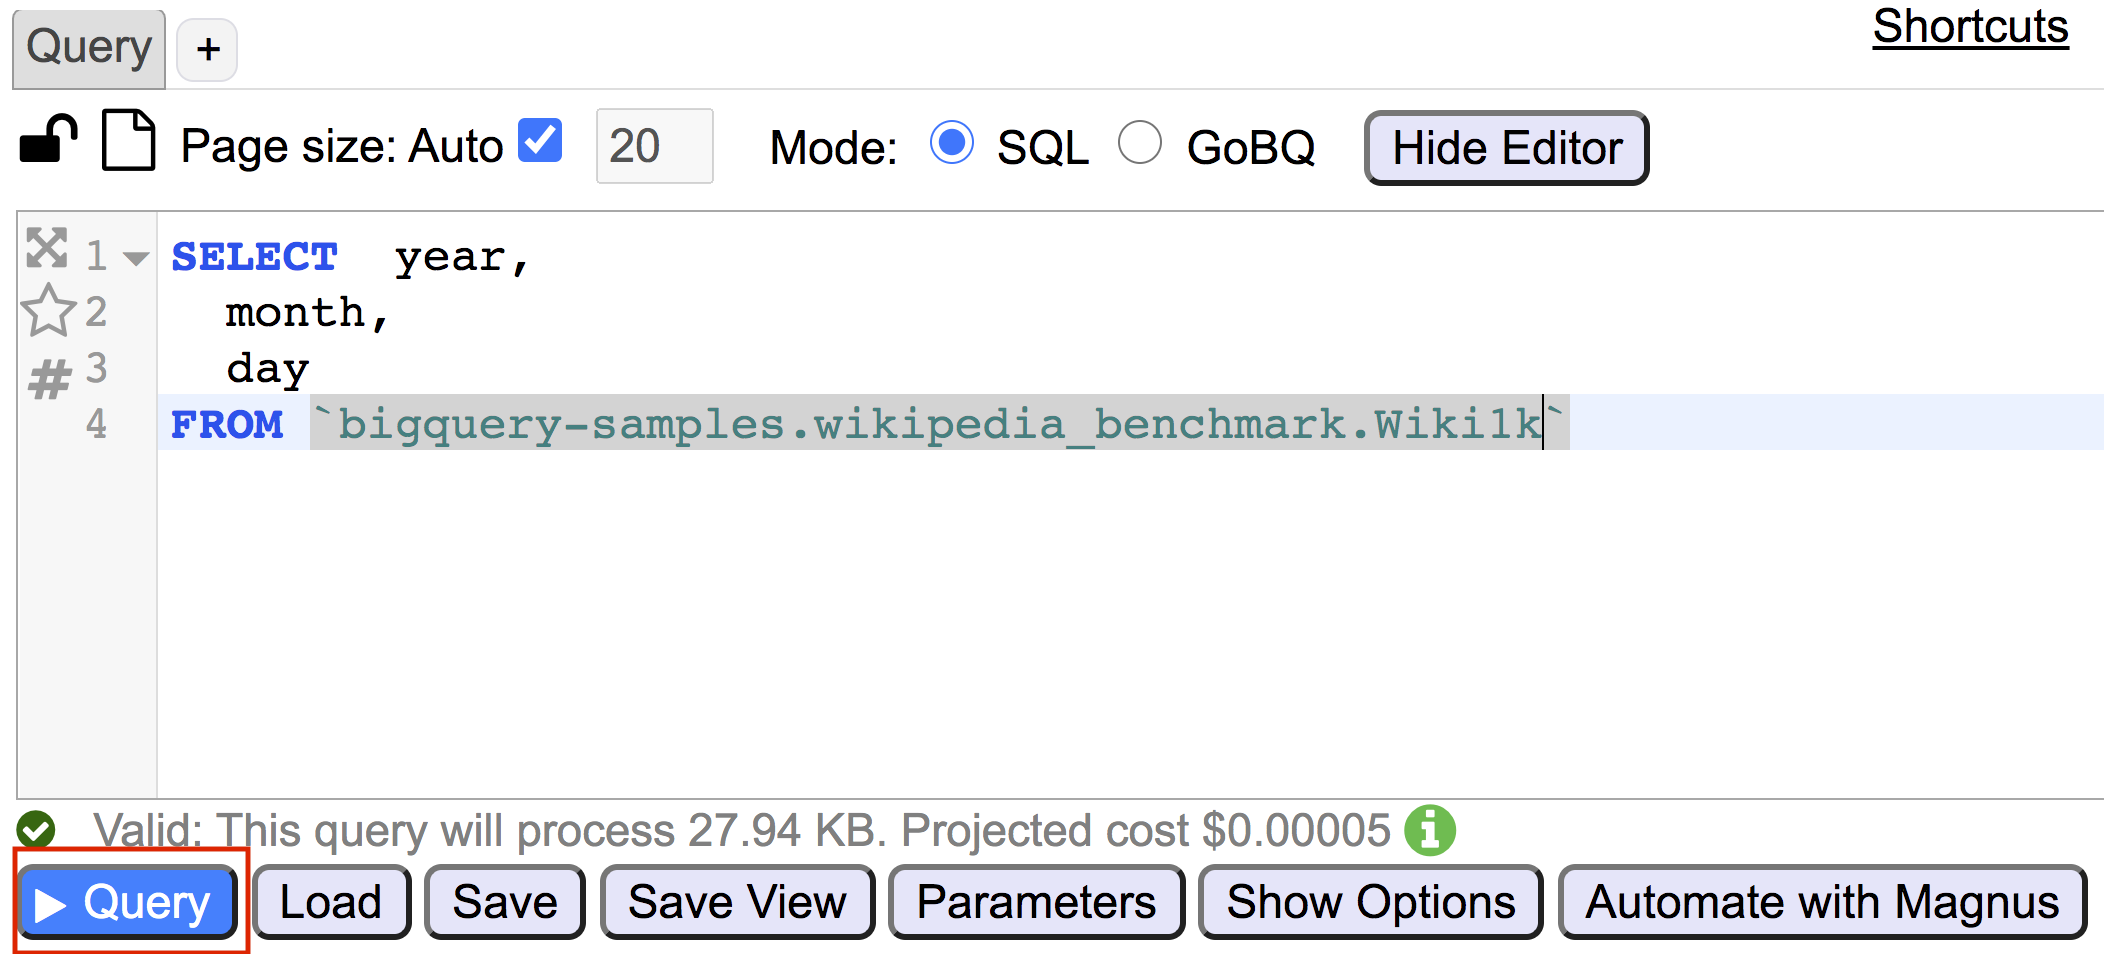
A query is running notification will display. The processing time will be displayed as duration
6. Results are displayed in a table in the results panel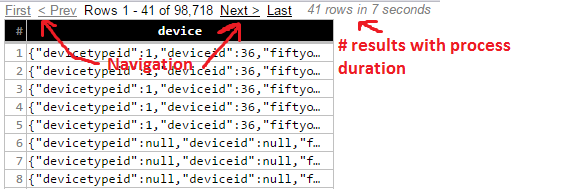
Record datatype columns are presented in JSON format. To access JSON viewer double click in the result column table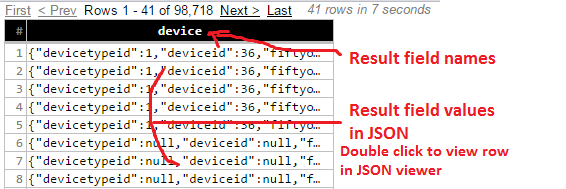
JSON viewer displays result for specific row in JSON format
Navigation options are available in upper right of JSON viewer and traverses through rows and columns
Collapse and Expand All options are available in upper right of JSON viewer which collapse or expand all nodes of displayed row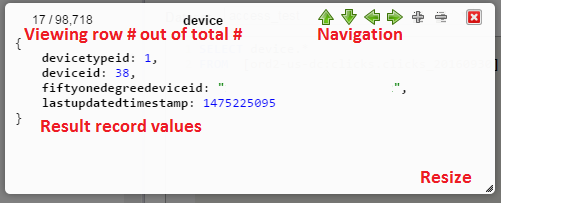
How to Explore Table Data
1. Preview Mode allows exploring / navigating of a table’s data
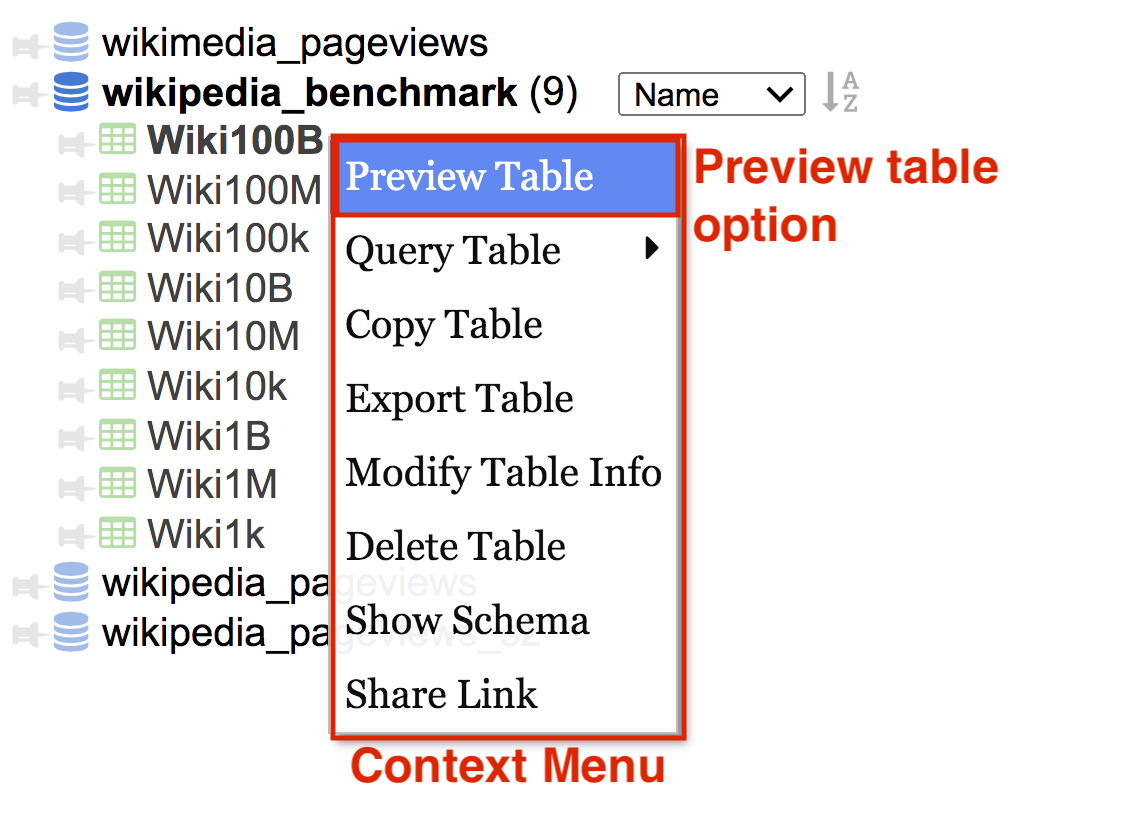
2. Select the table to be previewed
Right click on table in Nav or Dataset Browser to bring up Table Context Menu and select Preview Table
Results are displayed in a table in the results panel