This article provides users with a general guide to the features listed.
These features may have been updated or superseded by additions found in the release notes.
Read the content below to become familiar with the feature and review the release notes to get the latest iteration.
Overview
Data Explorer displays the results of a query
- Results are displayed in a data grid and are flattened. For JSON format enable enhanced in options
- Queries with numerous rows are displayed by navigating though paging
Below are detailed descriptions of these features
Data-Grid
Results are displayed in a table.
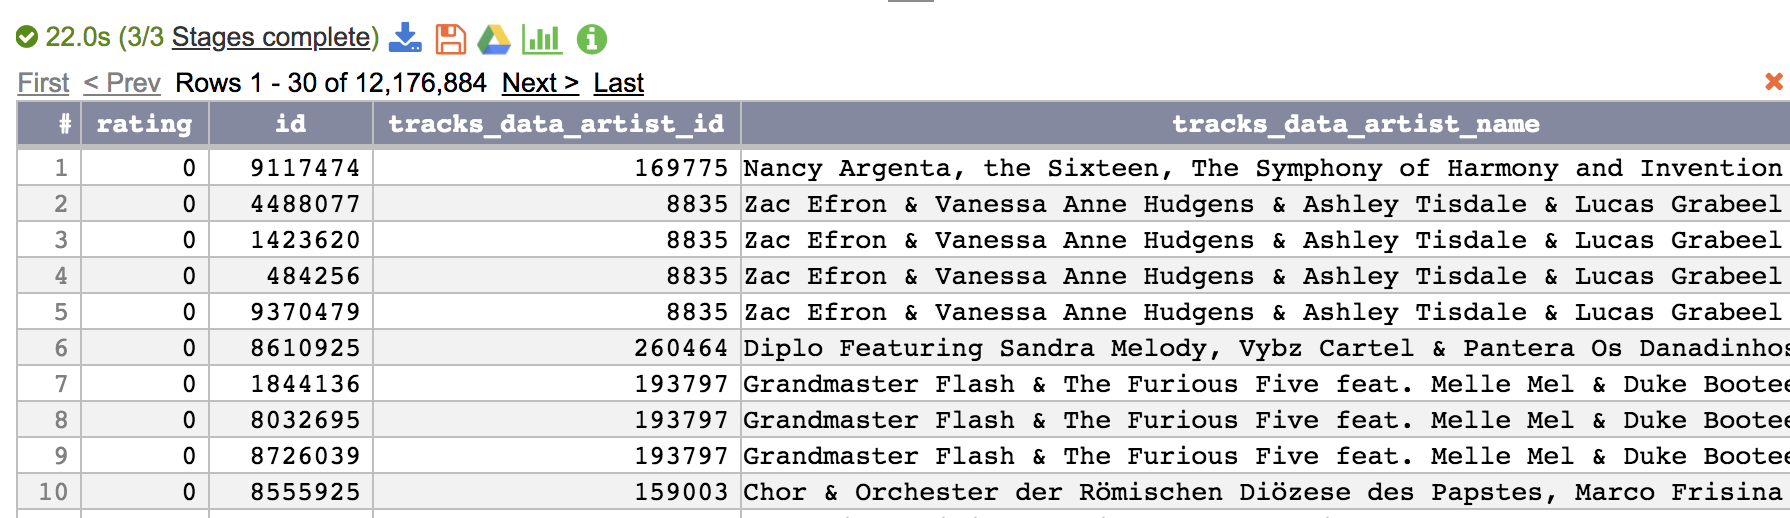
Results are flattened.
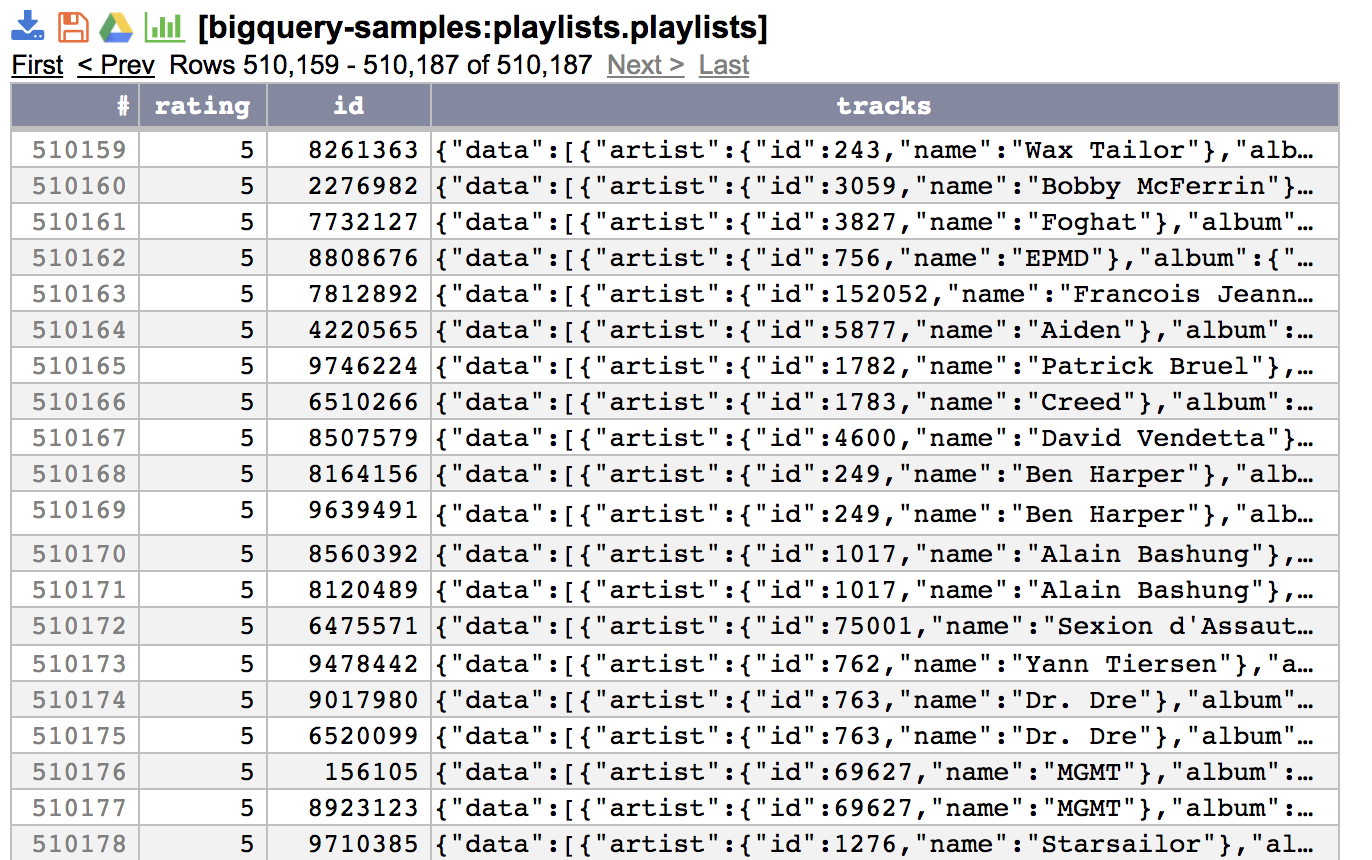
Enhanced results are presented in JSON which are available through a viewer (double-click table)
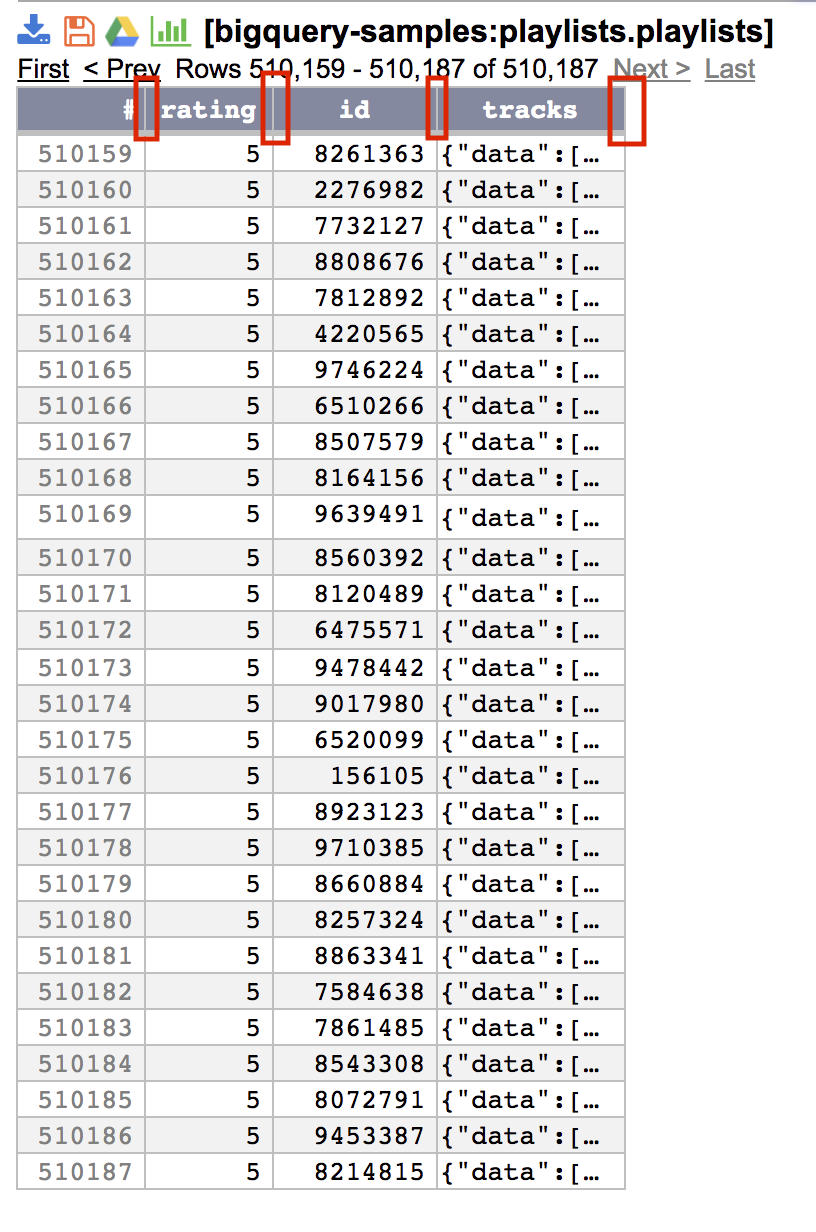
Resizable Columns in Results
Columns within results browsers (ex. Project Browser, Dataset Browser, Jobs History Browser) are resizable by dragging the right edge of a column and moving the mouse left or right.
Column resizing is not available for results with more than 10,000 visible cells.
Hierarchical View
Concept
Layout
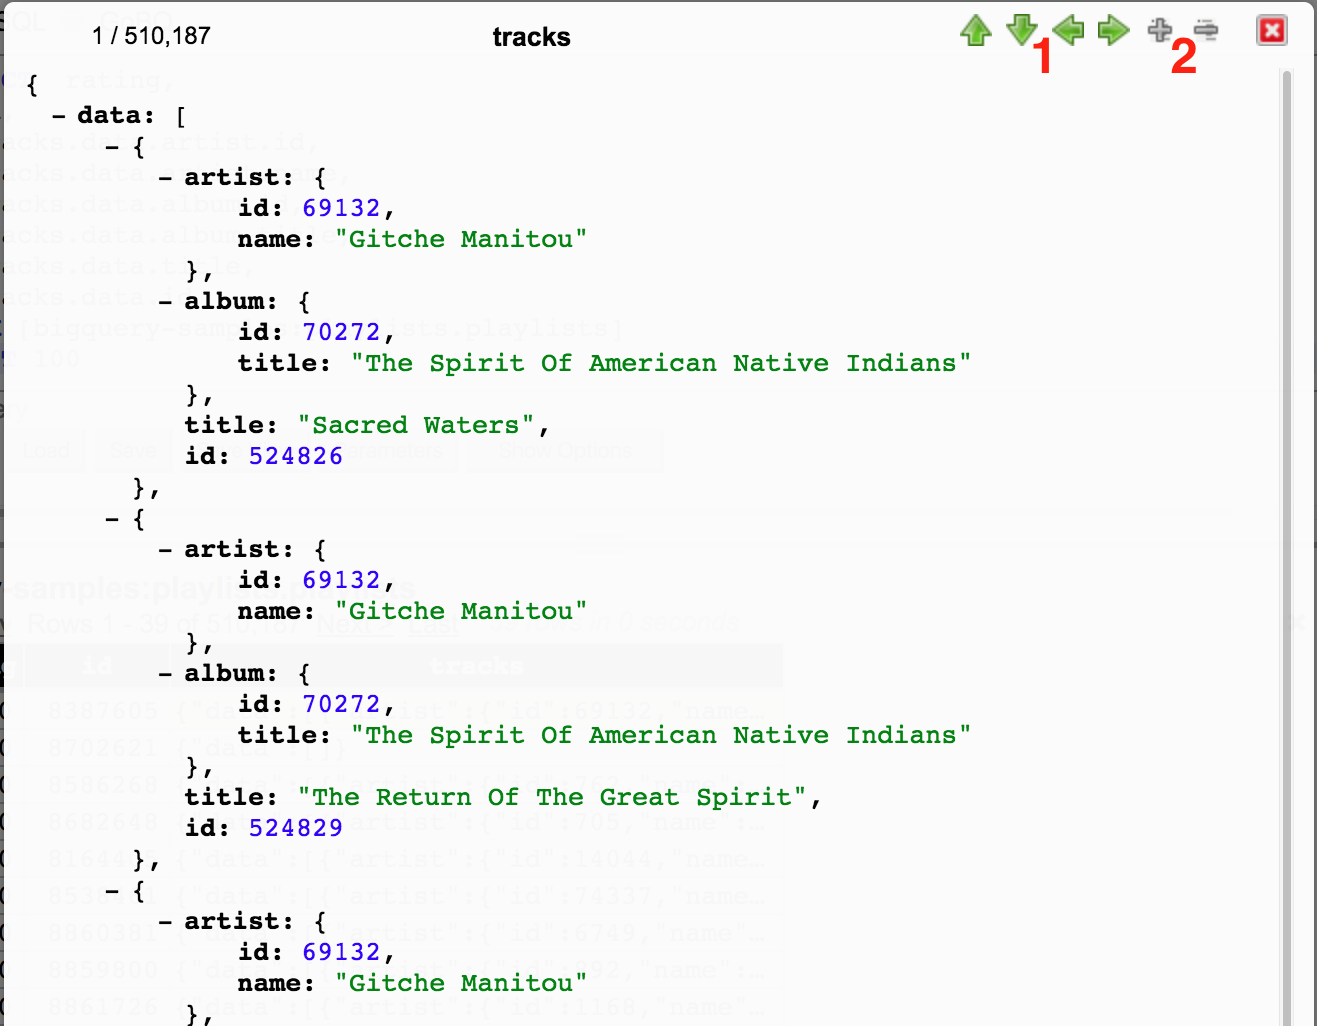 |
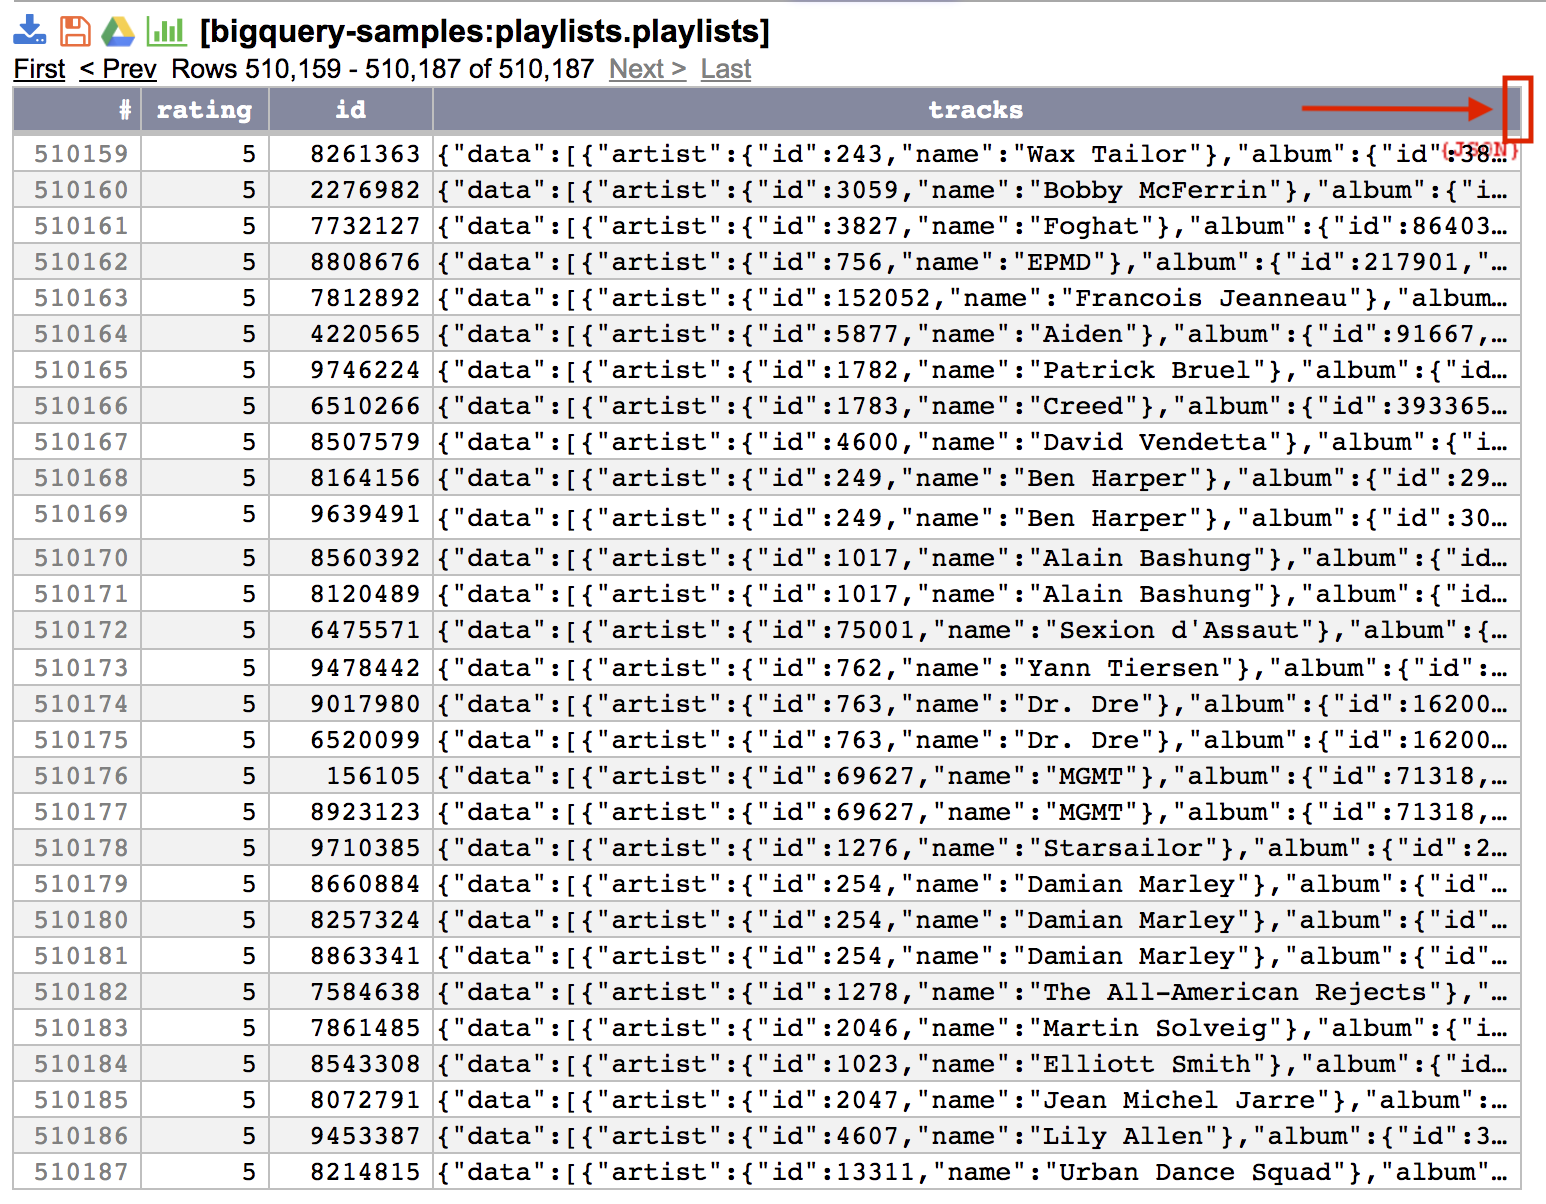
Double-clicking anywhere on Enhanced results pops up the JSON viewer. The viewer formats JSON for readability.
|
Navigation
Paging & Info

The group of rows being viewed out of total number of rows are displayed. Results with numerous rows are paged based on page size selection. Paging options include
| Navigation | Description |
| First | Displays rows at beginning of table. Greyed out if at the beginning |
| Prev | Displays the previous page of rows. Greyed out if no previous page to display |
| Next | Displays next page of rows. Greyed out if no next page to display |
| Last | Display the rows found at the end of the table. Greyed out if at the end of table |