This article provides users with a general guide to the features listed.
These features may have been updated or superseded by additions found in the release notes.
Read the content below to become familiar with the feature and review the release notes to get the latest iteration.
Execution Details is composed of Query Execution Timeline and Query Execution Plan.
Query Execution Timeline and Query Execution Plan are graphical representations of query execution statistics.
For more information on Query Plan and Timeline visit the BigQuery documentation:
Query plan and timeline
Viewing Execution Details
Execution Details are exposed within Job History and the query results panel.
Opening Execution Details from Jobs History
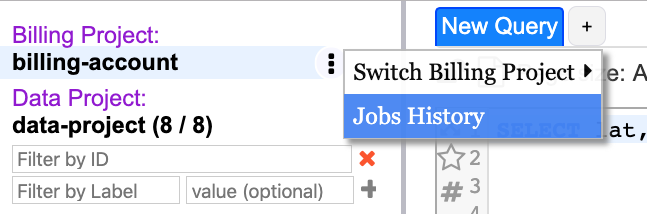
- Right-click on billing project or left click hover menu to bring up the billing project context menu.
- From the billing project context menu select “Jobs History” to the view list of jobs
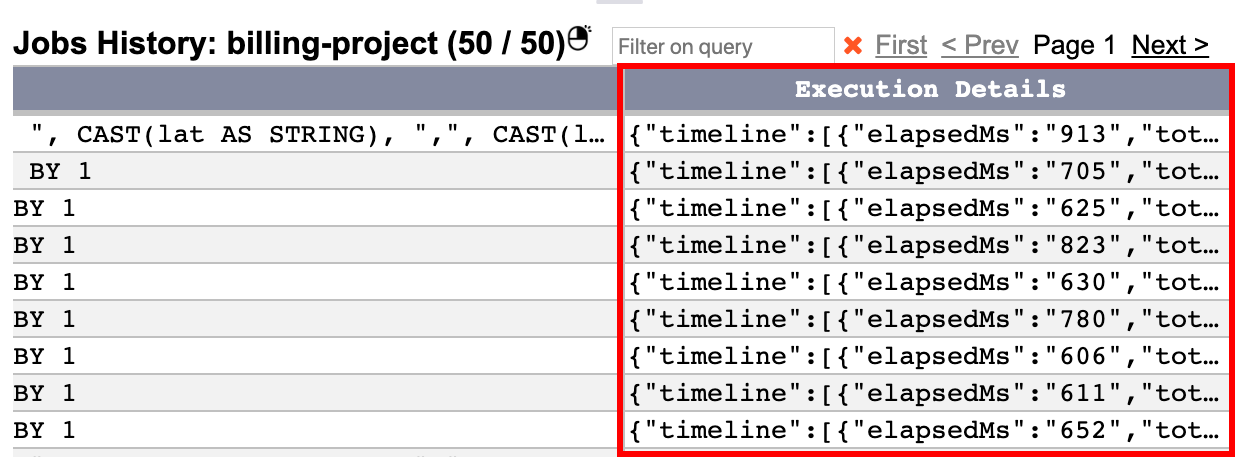
- In the job history results locate the execution details column
- Double-click a cell in the execution details column to open the Job History viewer
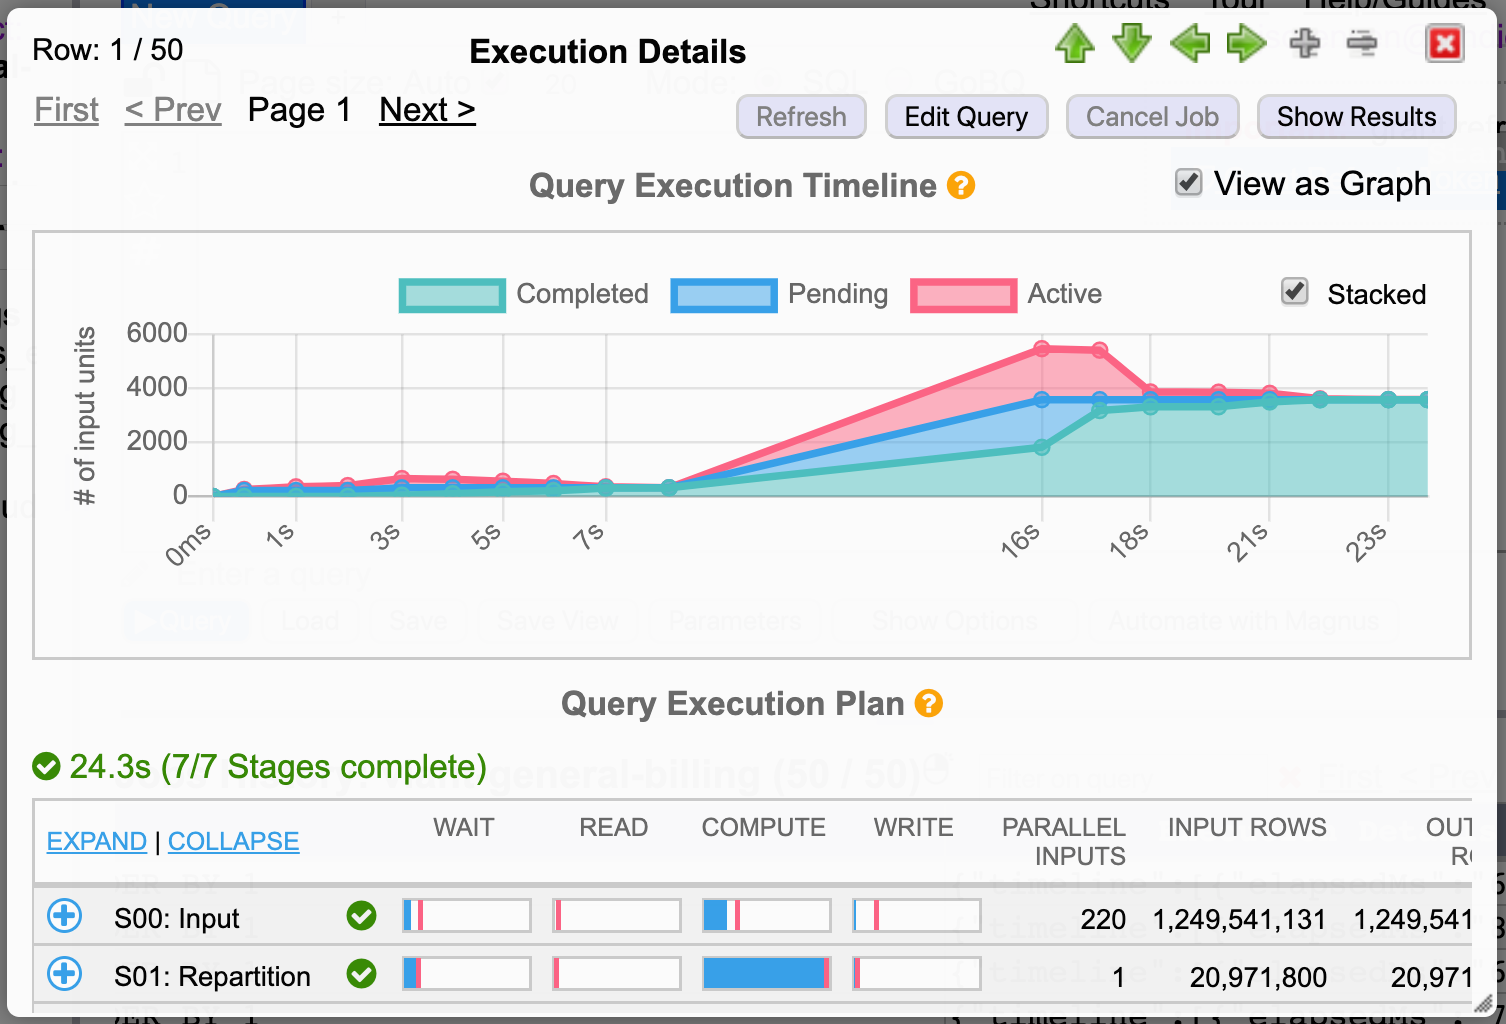
Execution Details are displayed graphically within the Jobs History viewer.
Opening Execution Details from the Query Results Pane
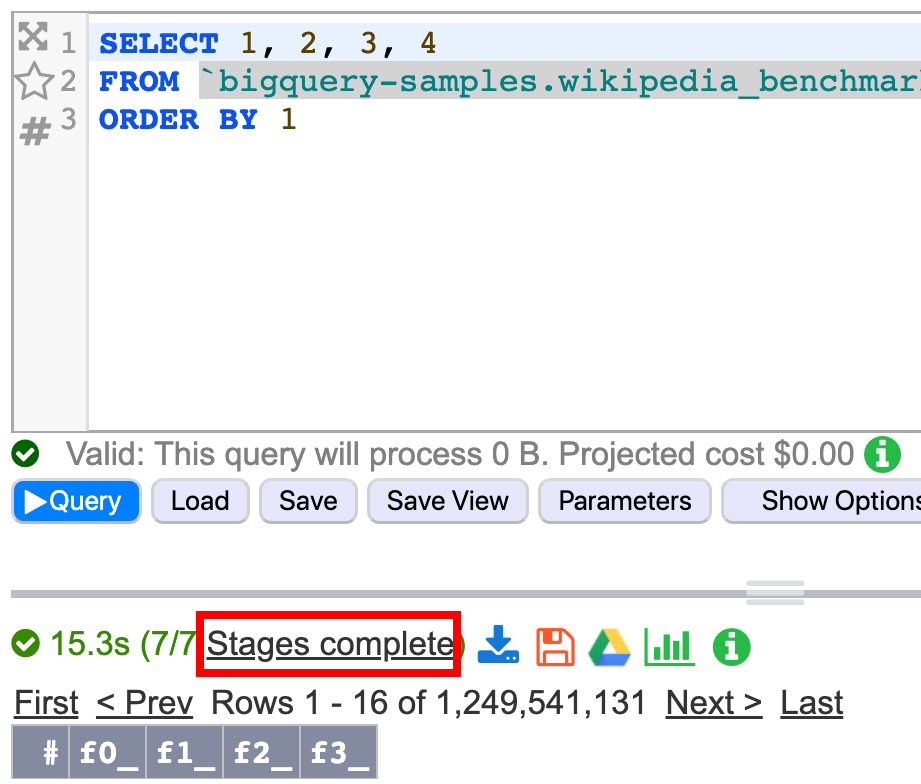
Within the query results pane the Query Timer displays the elapsed time of the query, the number of stages in progress out of the total number of stages, and the stages complete for a running, successful, failed, or cancelled query.
To view Execution Details:
- Run a query by entering a query in the editor and clicking Run Query.
- To view the Execution Details of a running, successful, failed, or cancelled query, click on "Stages complete”
Query Execution Timeline
The Query Execution Timeline is displayed as a stacked area graph representing completed, active and pending units of work over execution time. This timeline shows the progress of a query throughout the execution lifecycle.
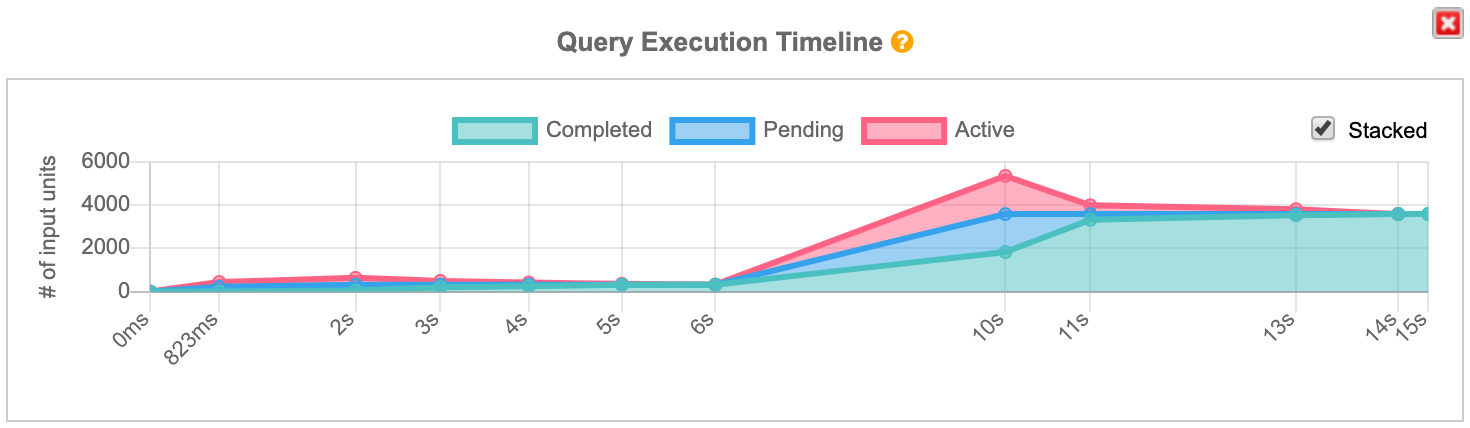 The Query Execution Timeline.
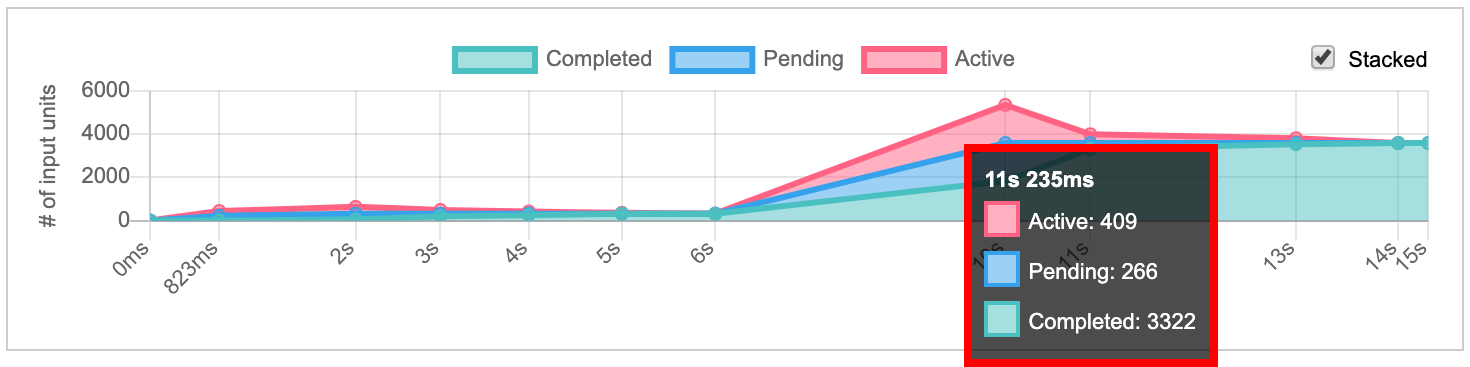
The underlying data for the Query Execution Timeline is viewable by moving the mouse over the graph. The closest point on the timeline will reveal a tooltip showing the numbers of active, pending and completed units of work in addition to the execution time for that point.
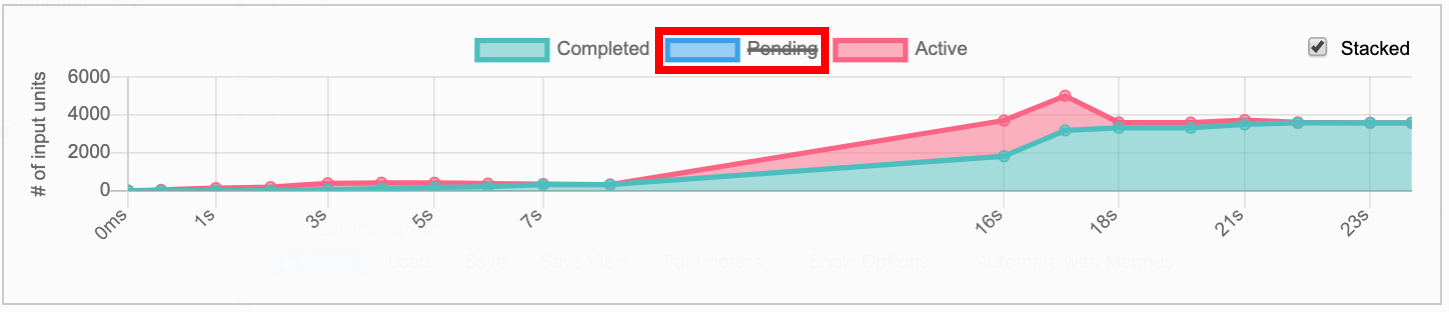 Units of work can be toggled on or off by clicking the color-coded labels in the legend.
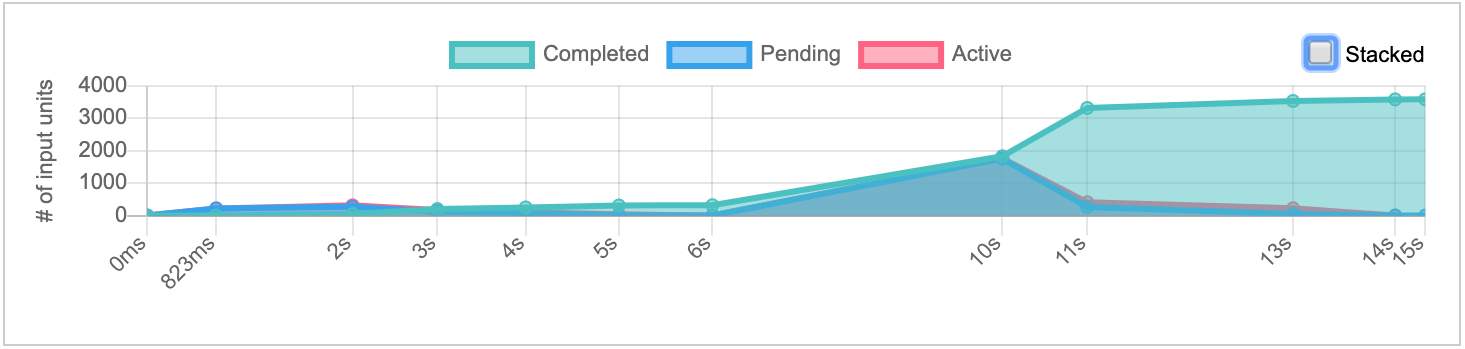 By default, the Query Execution Timeline is displayed as a stacked area chart. To view as a non-stacked area chart, uncheck the “Stacked” check box.
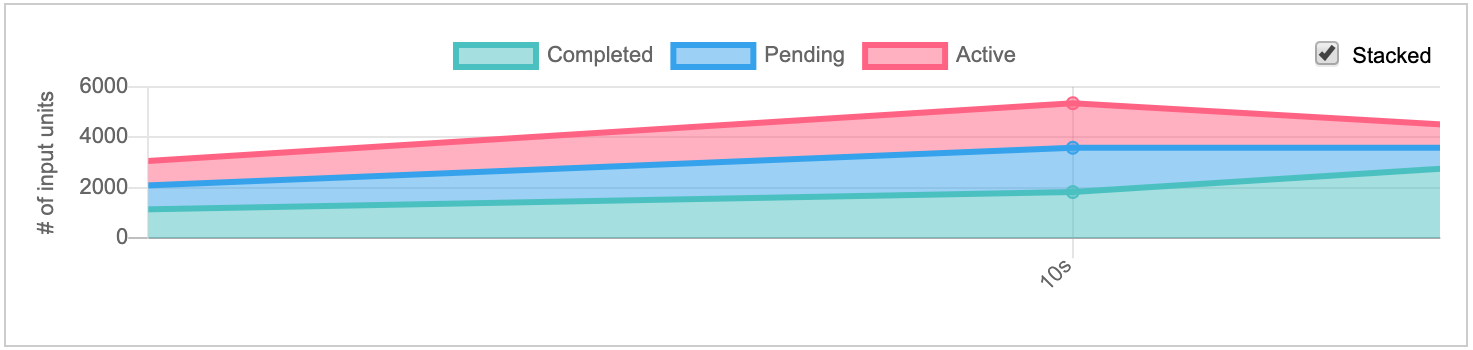 To zoom the Query Execution Timeline in or out rotate the mouse wheel. To pan the chart after zooming in, click and drag using the mouse.
Query Execution Plan
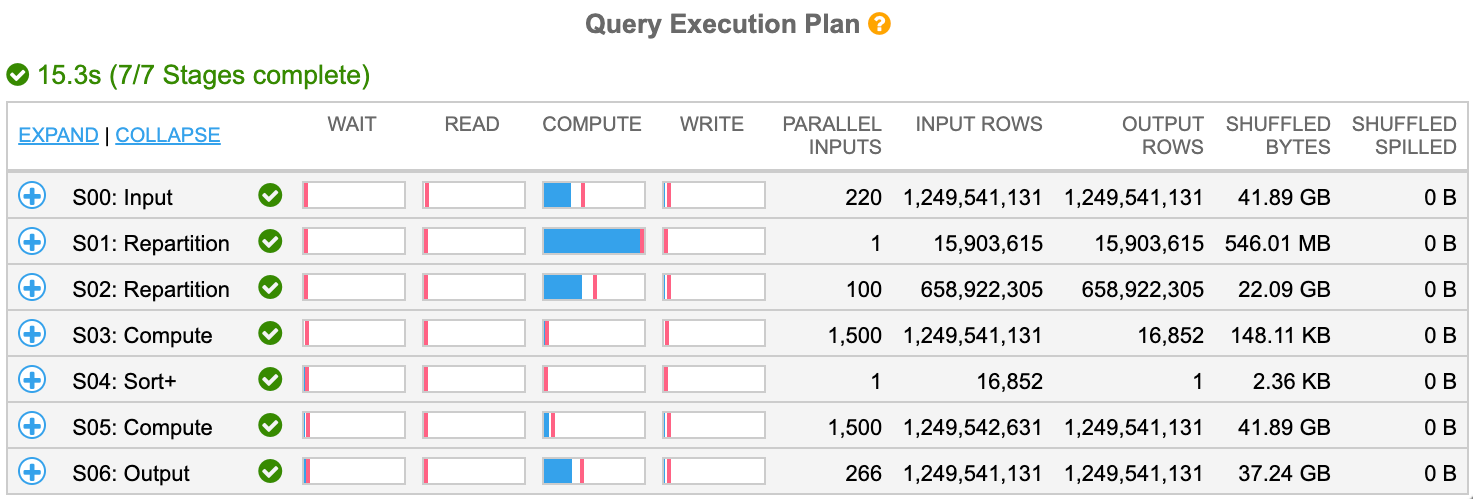
The Query Execution Plan consists of the Query Timer and an expandable table showing query stage statistics. Within the expandable rows, detailed steps are displayed for each stage.
Each row displays stage timing details and statistics.
Query Timer
The Query Timer displays the elapsed time and number of stages completed for a running, successful, failed or cancelled query.

Running queries are indicated by a spinning icon and blue text. The timer counts in increments of 100 milliseconds.

A successfully completed query is indicated with green text showing a full stage completion count.

Failed queries are indicated in red text. Associated error messages are shown below the timer.

Cancelled queries are shown in yellow text.
Expanding and Collapsing rows

Click the “Expand” or “Collapse” links to open or close all rows in the table.
Individual rows can be expanded or collapsed by clicking on the row.
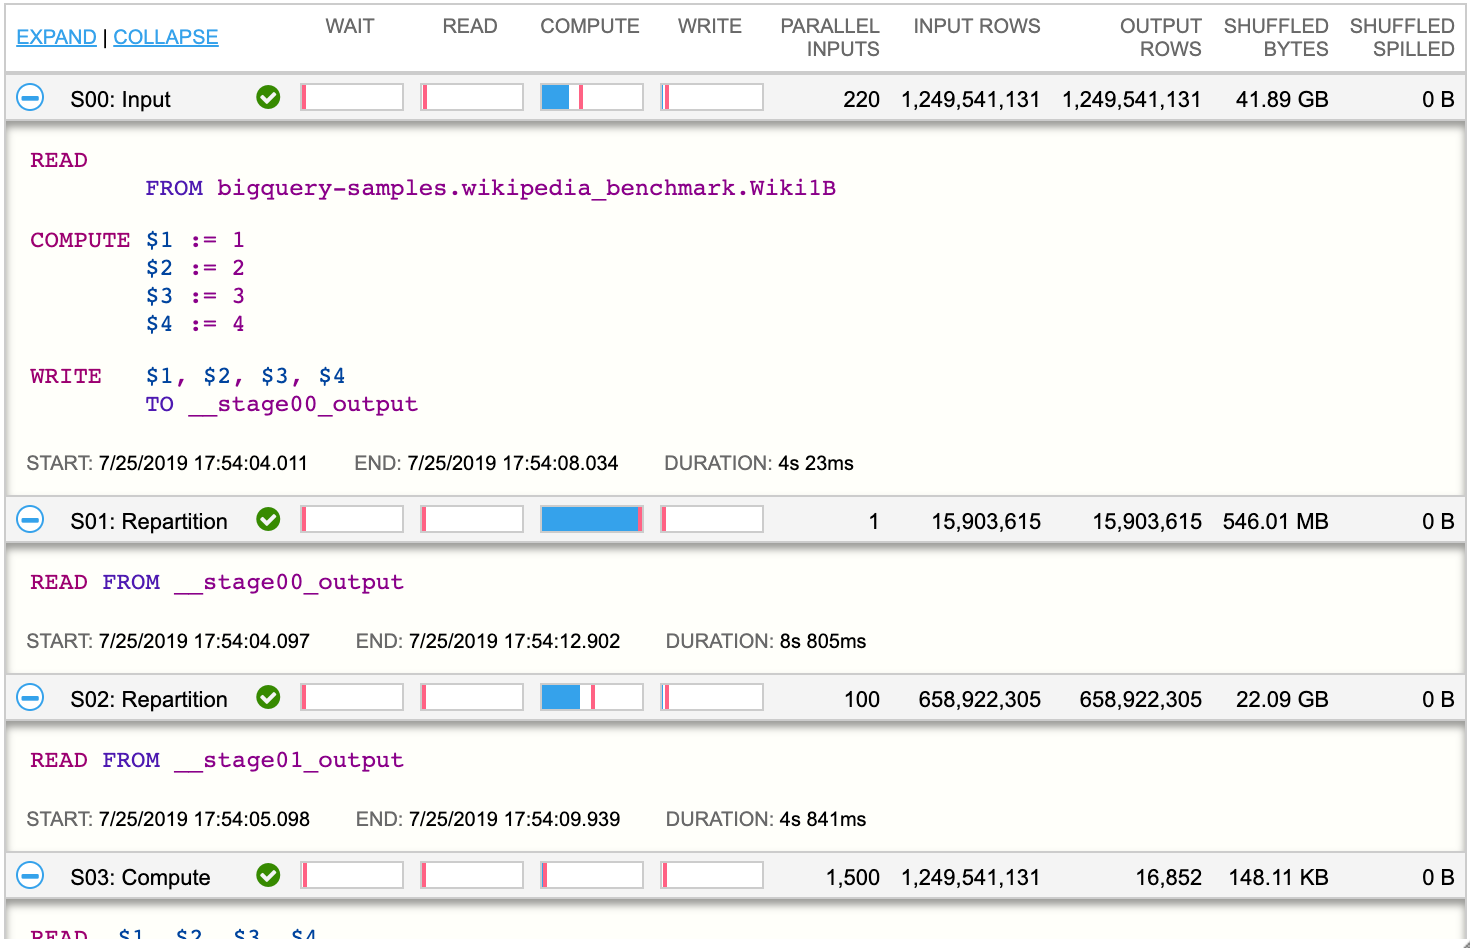 Expanded rows show the query plan step details for the Stage associated with the row.
Query Stages
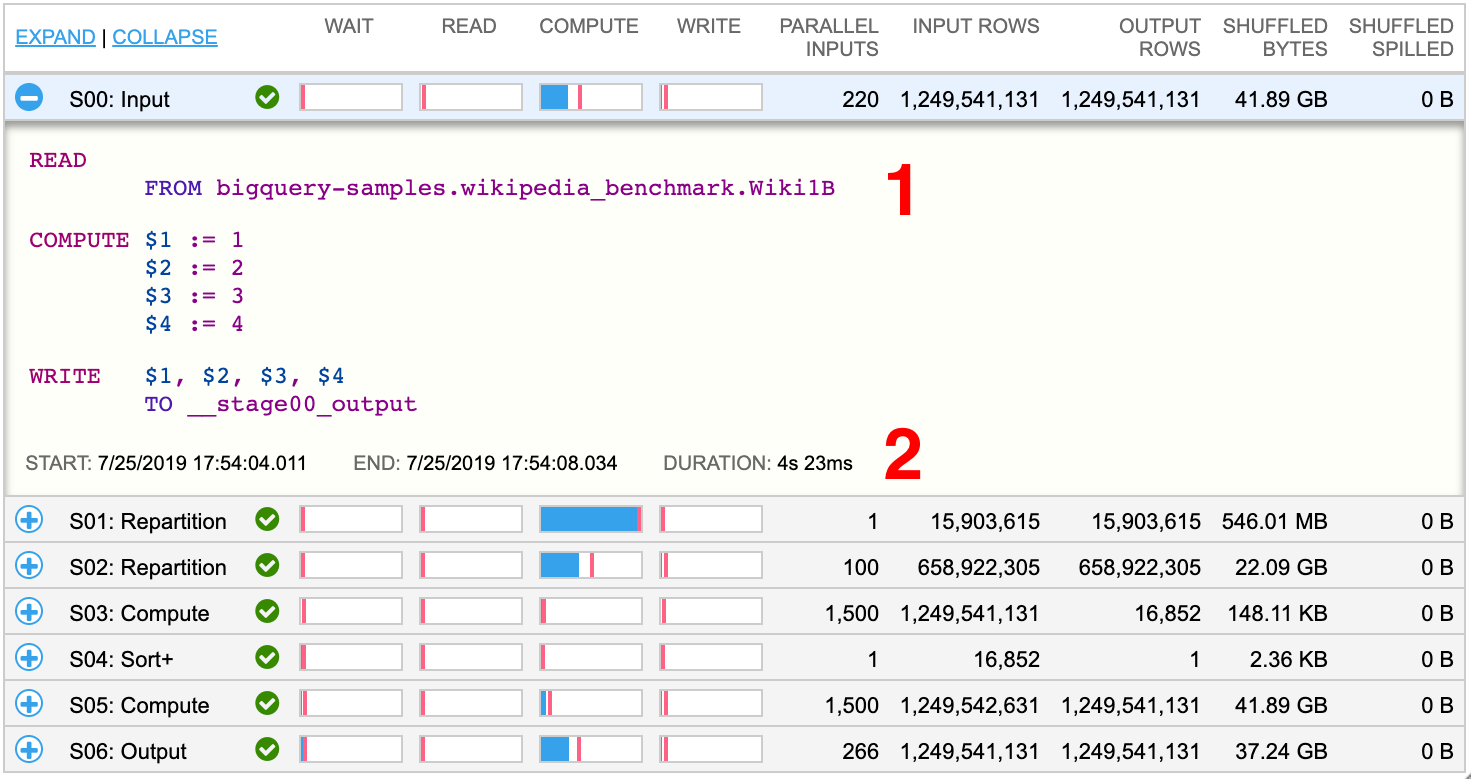
- Stage execution steps
- Stage start and end times, and total stage duration*
* The start and end times, and total stage duration will display as “N/A” for incomplete queries or when a query has failed or was cancelled.
Stage Timing Classifications
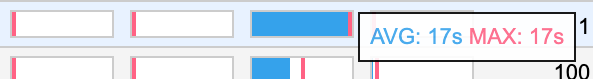
Per-stage timing classifications are viewable as charts within the stage rows. The relative timing is shown as a blue bar (average time) and a pink line (max time). The absolute timing is viewable as a tooltip by placing the mouse cursor over a chart.
Stage Status
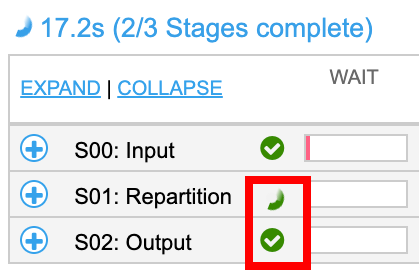
The status for a stage is displayed as an icon. For stages where no status is available, the icon is absent.
Stage Status Icons
 |
Pending |
 |
Running |
 |
Successful |
 |
Cancelled |
 |
Failed |
Stage Row Statistics

Each Query Execution Plan row shows statistics for a specific stage.
| Parallel Inputs | Number of parallelizable units of work for the stage |
| Input Rows | Input size of the stage as number of records, across all stage workers |
| Output Rows | Output size of the stage as number of records, across all stage workers |
| Shuffled Bytes | Total bytes written across all workers within a query stage |
| Shuffled Spilled | Amount of data spilled to disk |
Viewing Execution Details as JSON
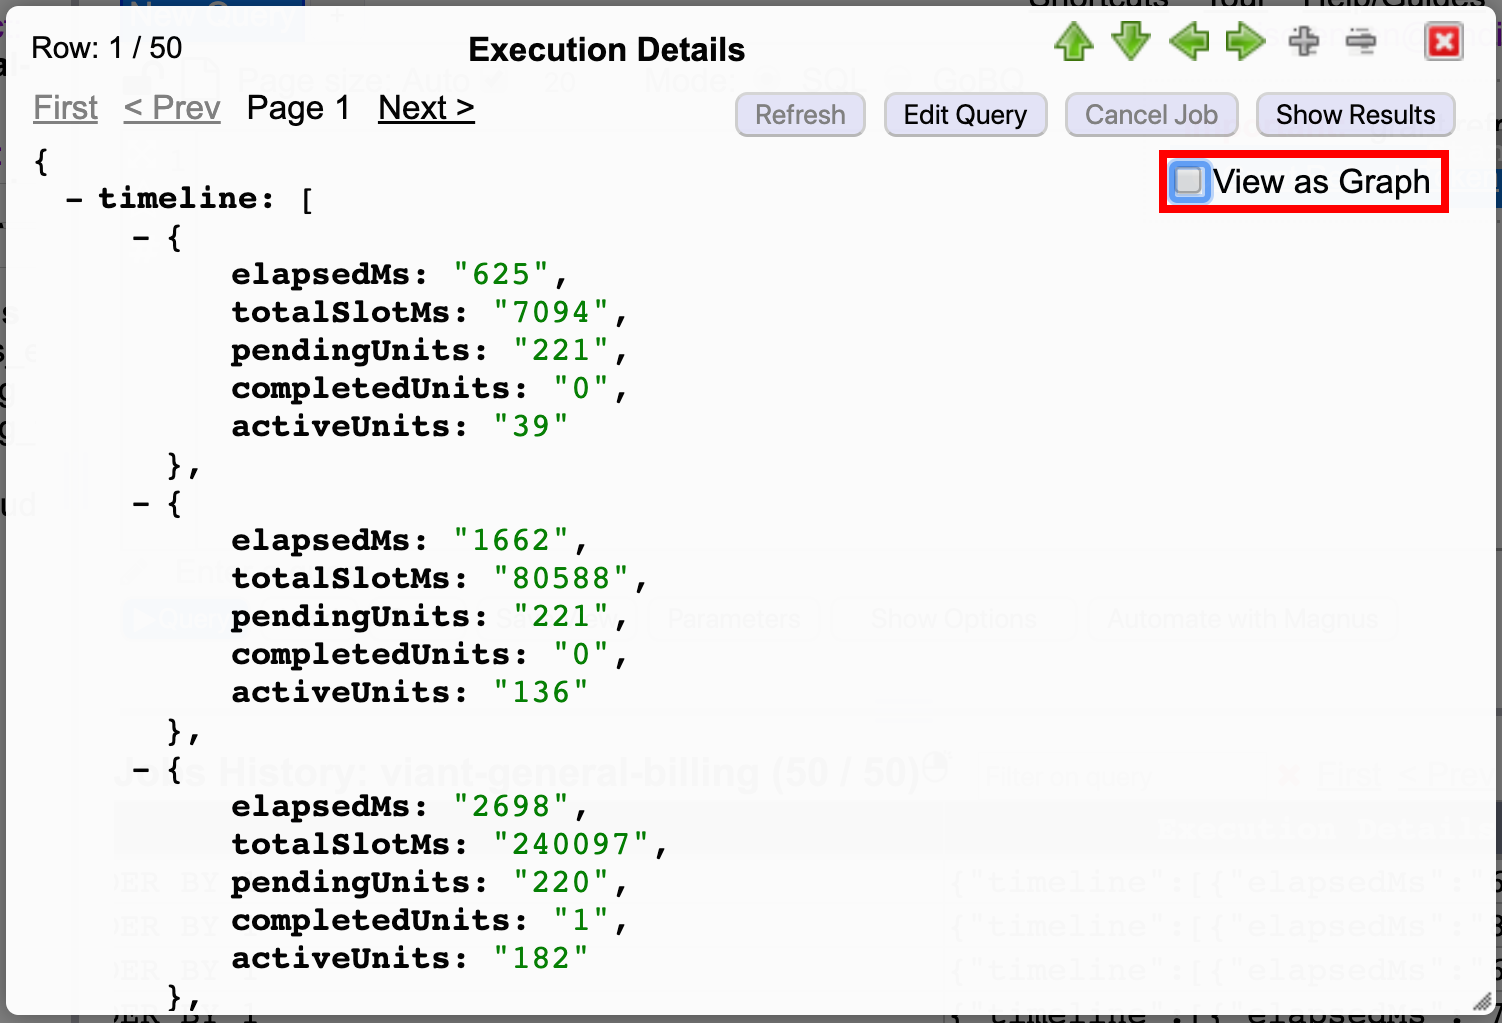
By default, the Execution Details are displayed graphically however by unchecking “View as Graph” in the Jobs History viewer the underlying JSON is shown