Magnus Dashboard
Magnus features a Dashboard that visualizes user associated workflow executions, displays execution failures, and provides an inventory list of workflows.
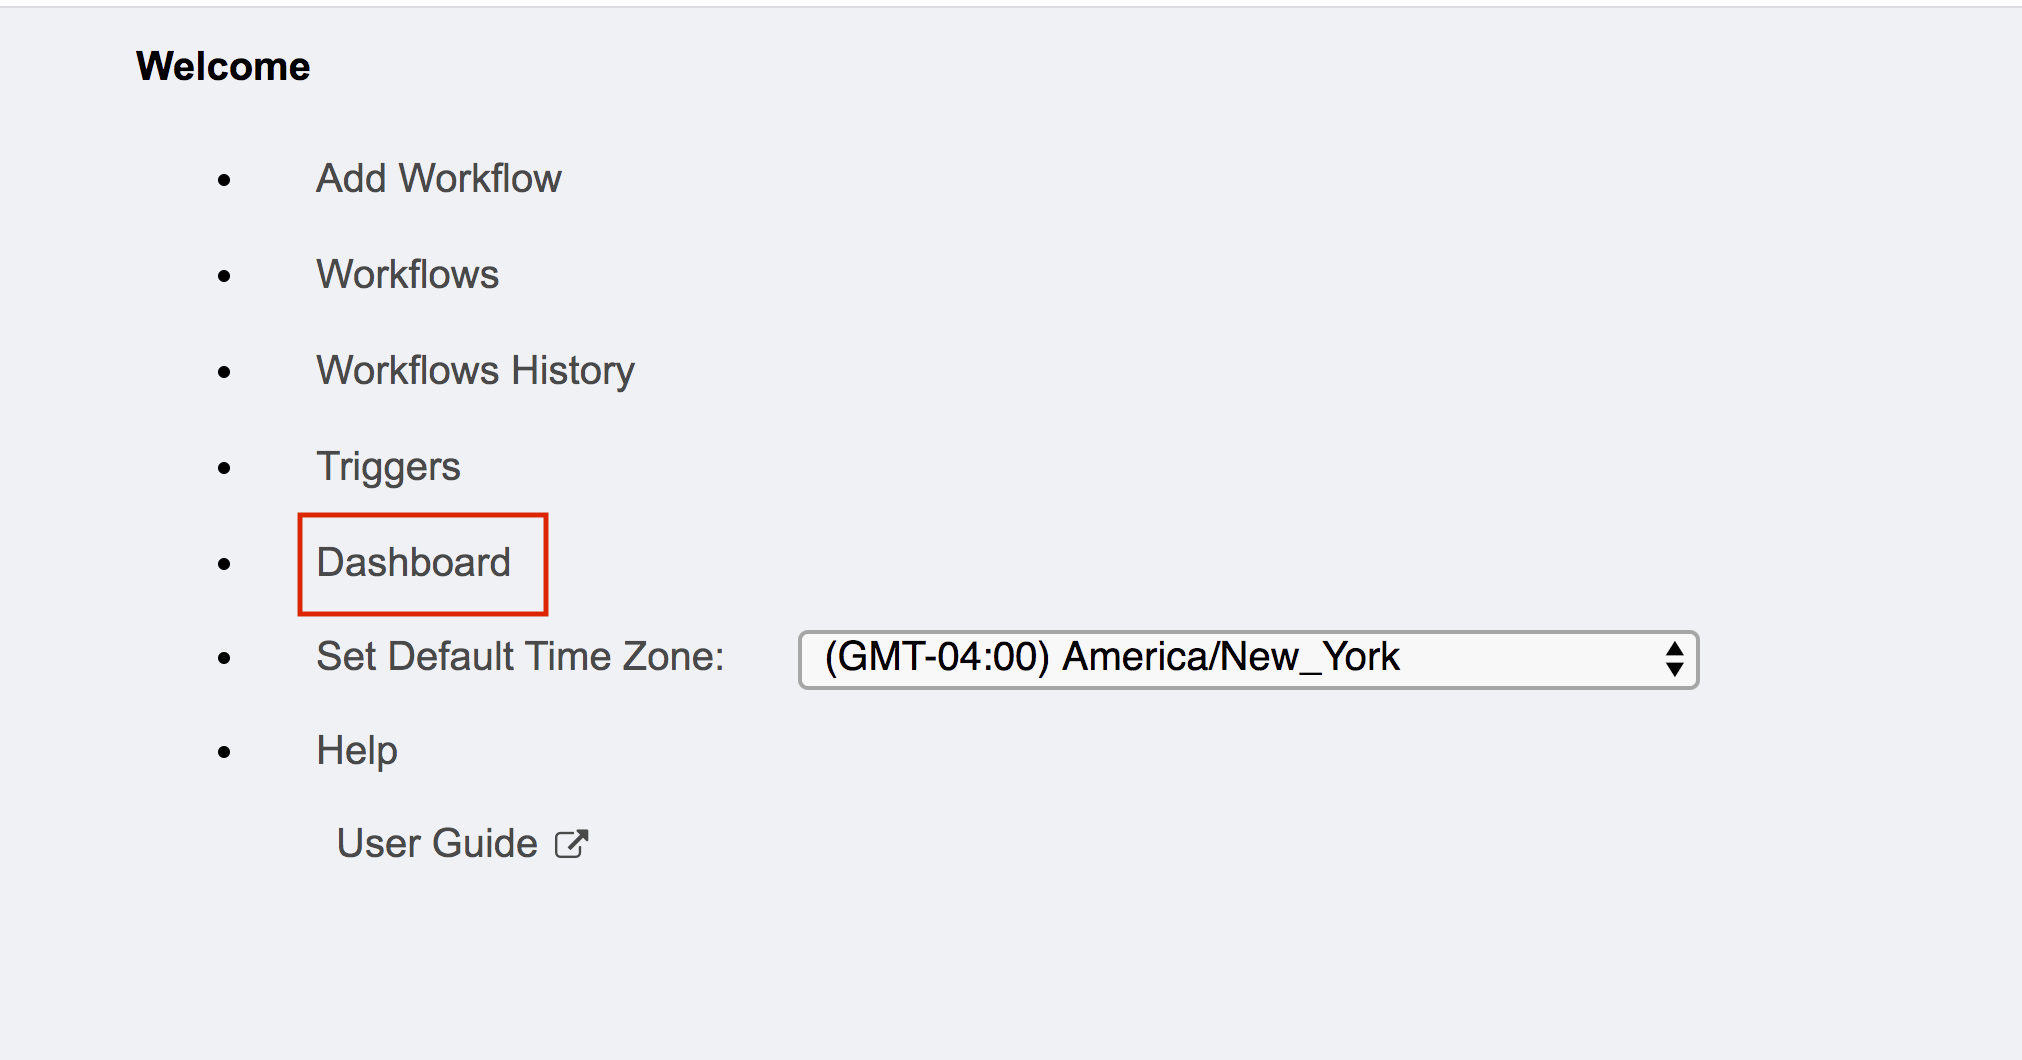
To access the Magnus Dashboard, click on Dashboard from the Home page.
Magnus Dashboard is a collection of several dashboards. It currently contains Timeline dashboard, Failed dashboard, and Inventory Dashboard.
Dashboard Cards
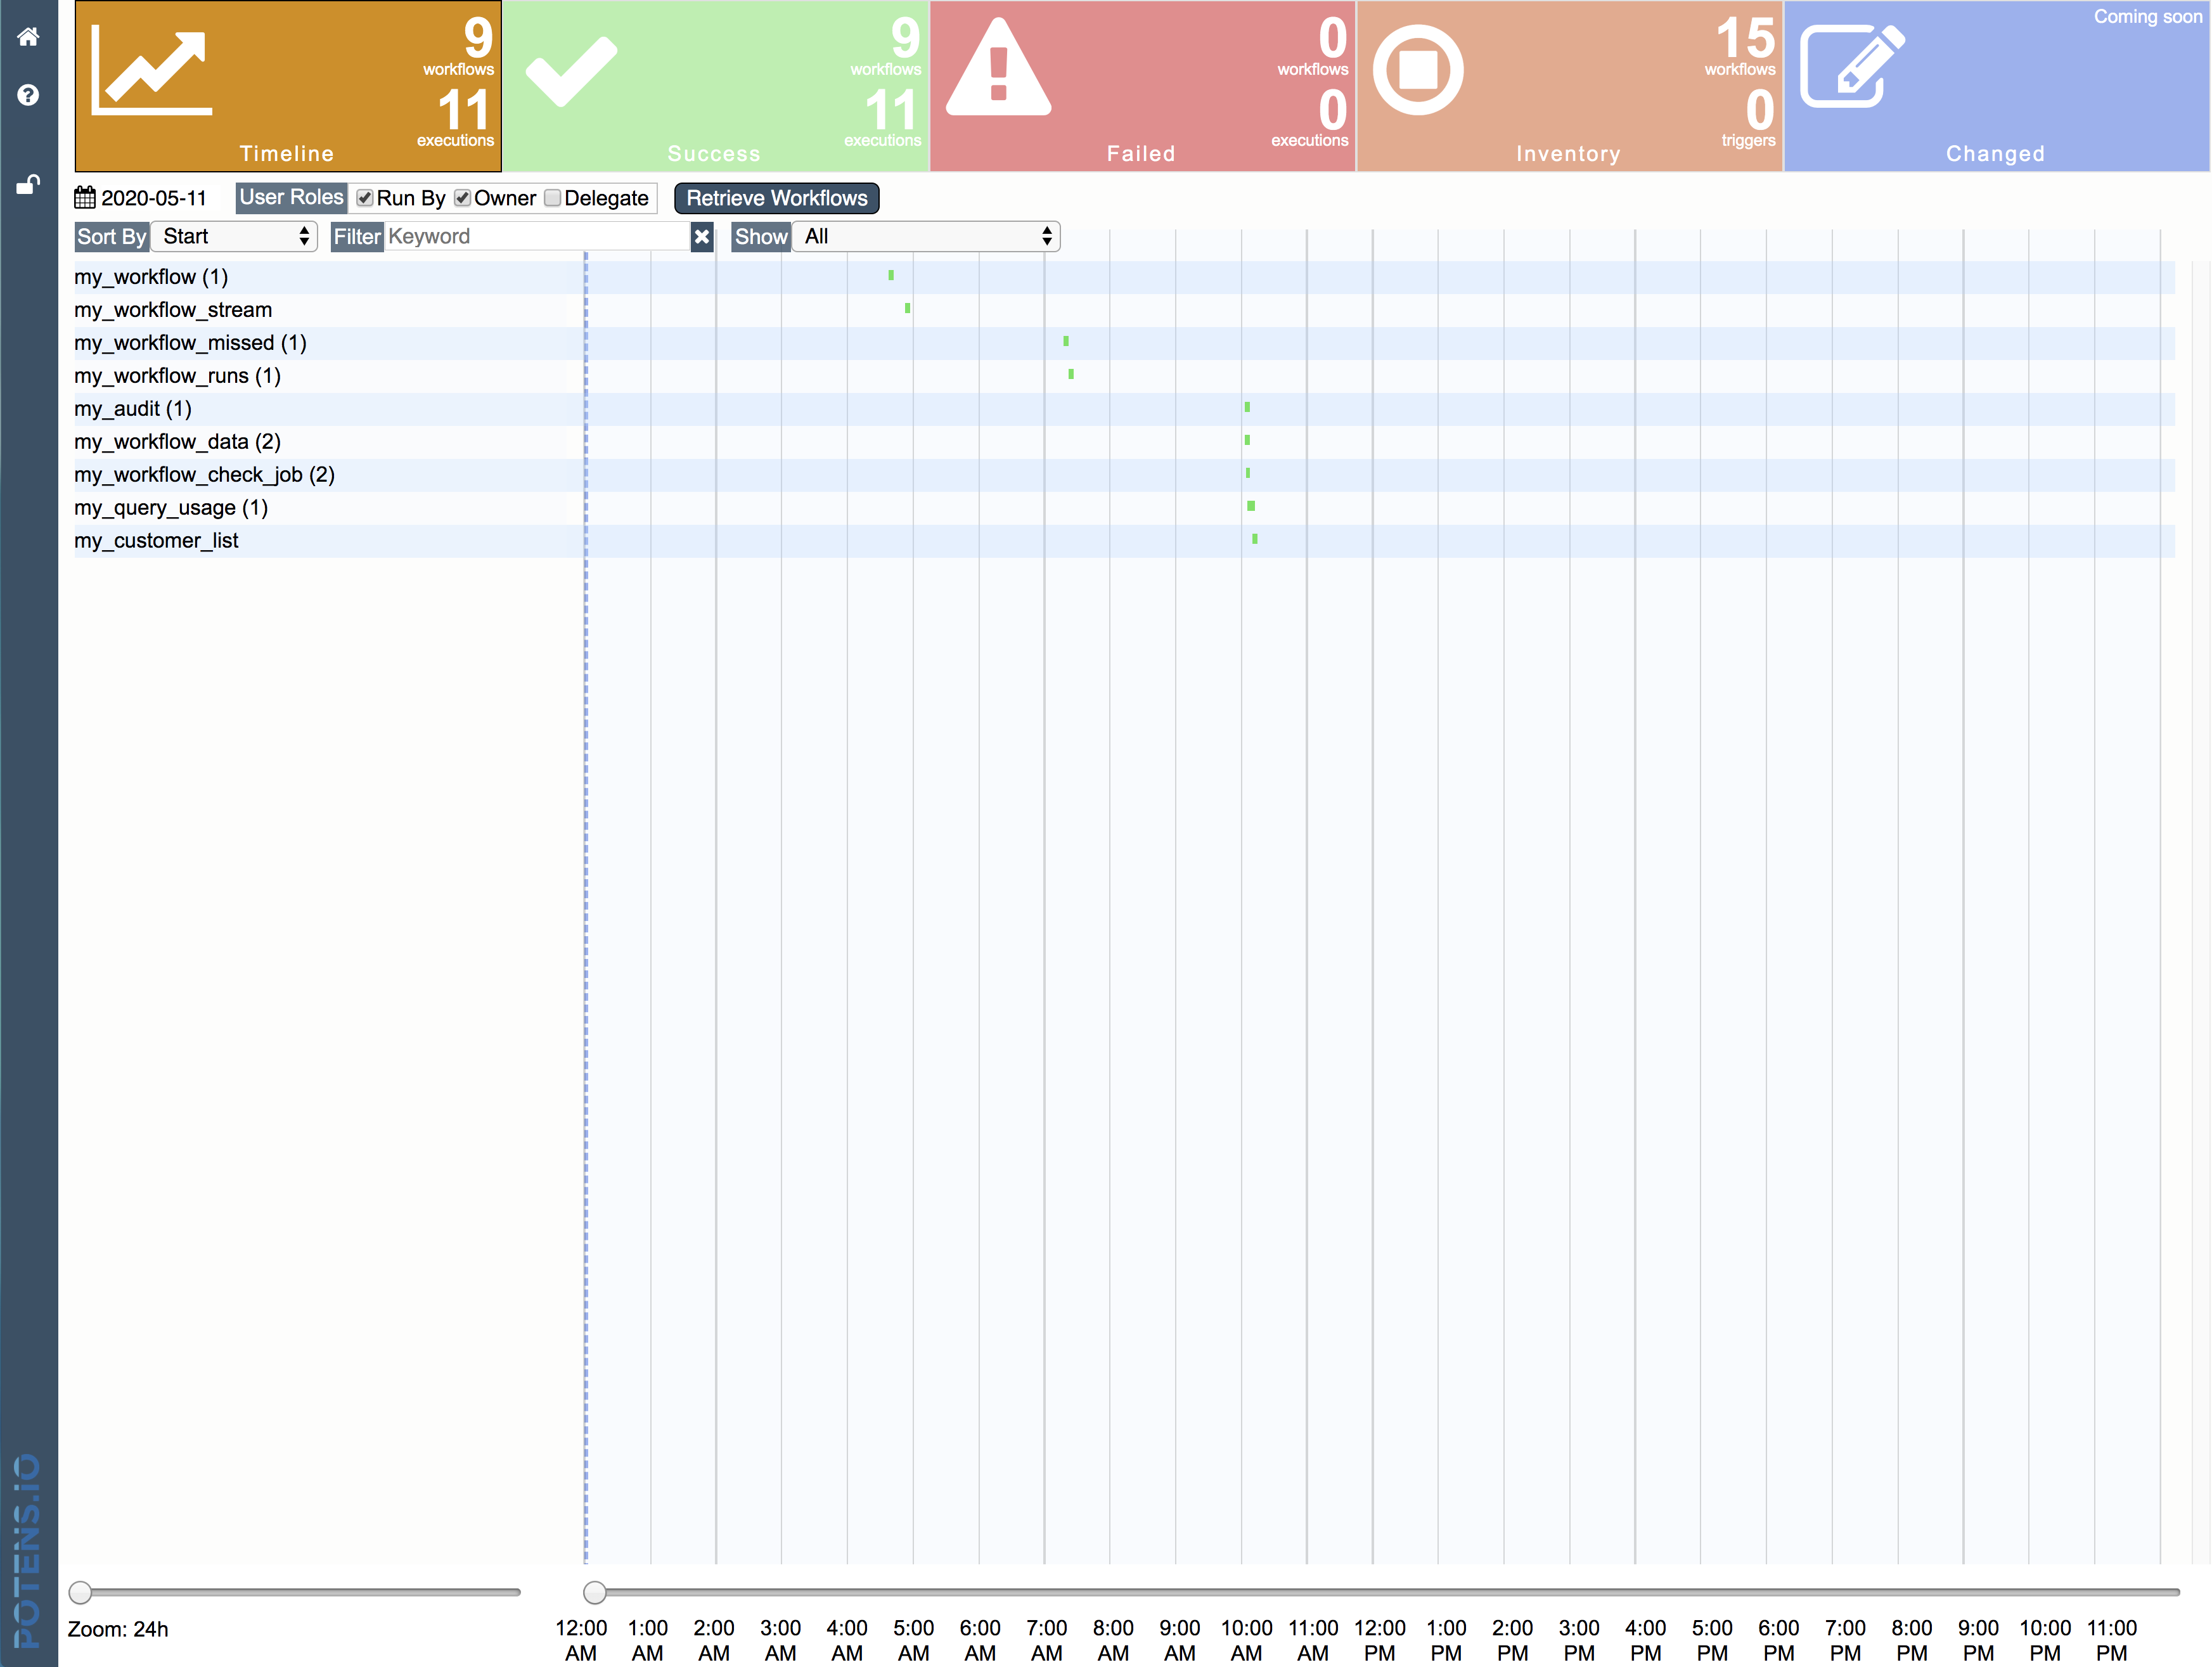
At the top of the Magnus Dashboard are dashboard cards that provide brief statistics for each dashboard. Clicking on the card will also load the related dashboard in the section below.

The cards include statistics for
Timeline displays how many user associated workflows were executed and the number of executions for the specified day. Clicking on this card loads the Timeline dashboard.
Success displays how many user associated workflows were successfully executed and the number of successful executions for the specified day. There currently is no Success dashboard and clicking on this card is not enabled.
Failed displays how many user associated workflows failed and the number of failed executions for the specified day. Clicking on this card loads the Failed dashboard.
Inventory displays current, as of now, count of workflows and triggers associated to the user. Clicking on this card loads the Inventory dashboard.
Changed is coming soon.
Timeline Dashboard
The timeline dashboard visualizes user associated workflow executions in swim lanes.
Timeline toolbar
The timeline toolbar provides options for retrieving workflows to visualize.

Options include
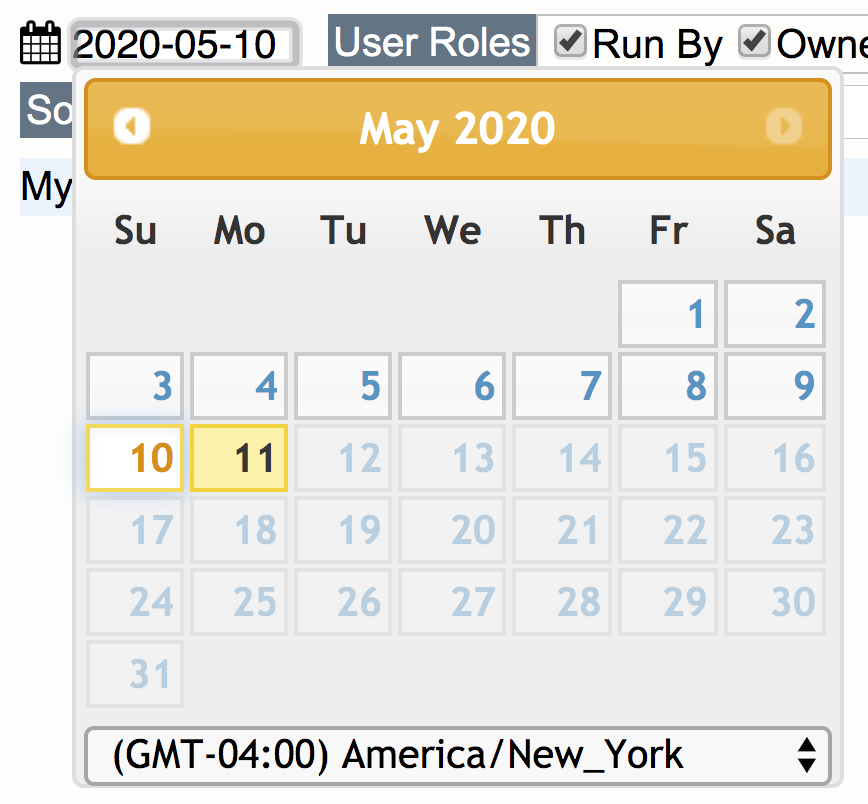
Calendar allows selecting the date and time zone for executions.
User Roles specifies association to the workflow execution.
Run By displays those workflows the user executed.
Owner displays executions for the workflows the user owns regardless of who executed it.
Delegate displays workflows executions the user is a delegate regardless of who executed it.

Retrieve Workflows submits the options selected to be displayed in the swim lanes.

Timeline Data Filtering Toolbar
When data is visualized a second toolbar is available to help with navigation and filtering.
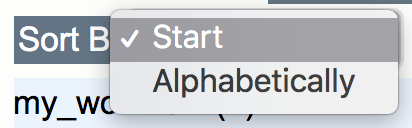
Sort By provides options for sorting the workflow by execution start time or alphabetically based on the workflow name.

Filter allows users to input text to filter based on the workflow name. Clicking on X clears the text.

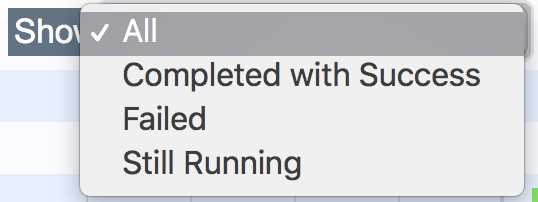
Show provides a drop down that allows filtering on the status of the execution which include Completed with Success, Failed, and Still Running.

Timeline Visualization
Workflow executions are visualized on a swim lane with the name of the workflow on the left.
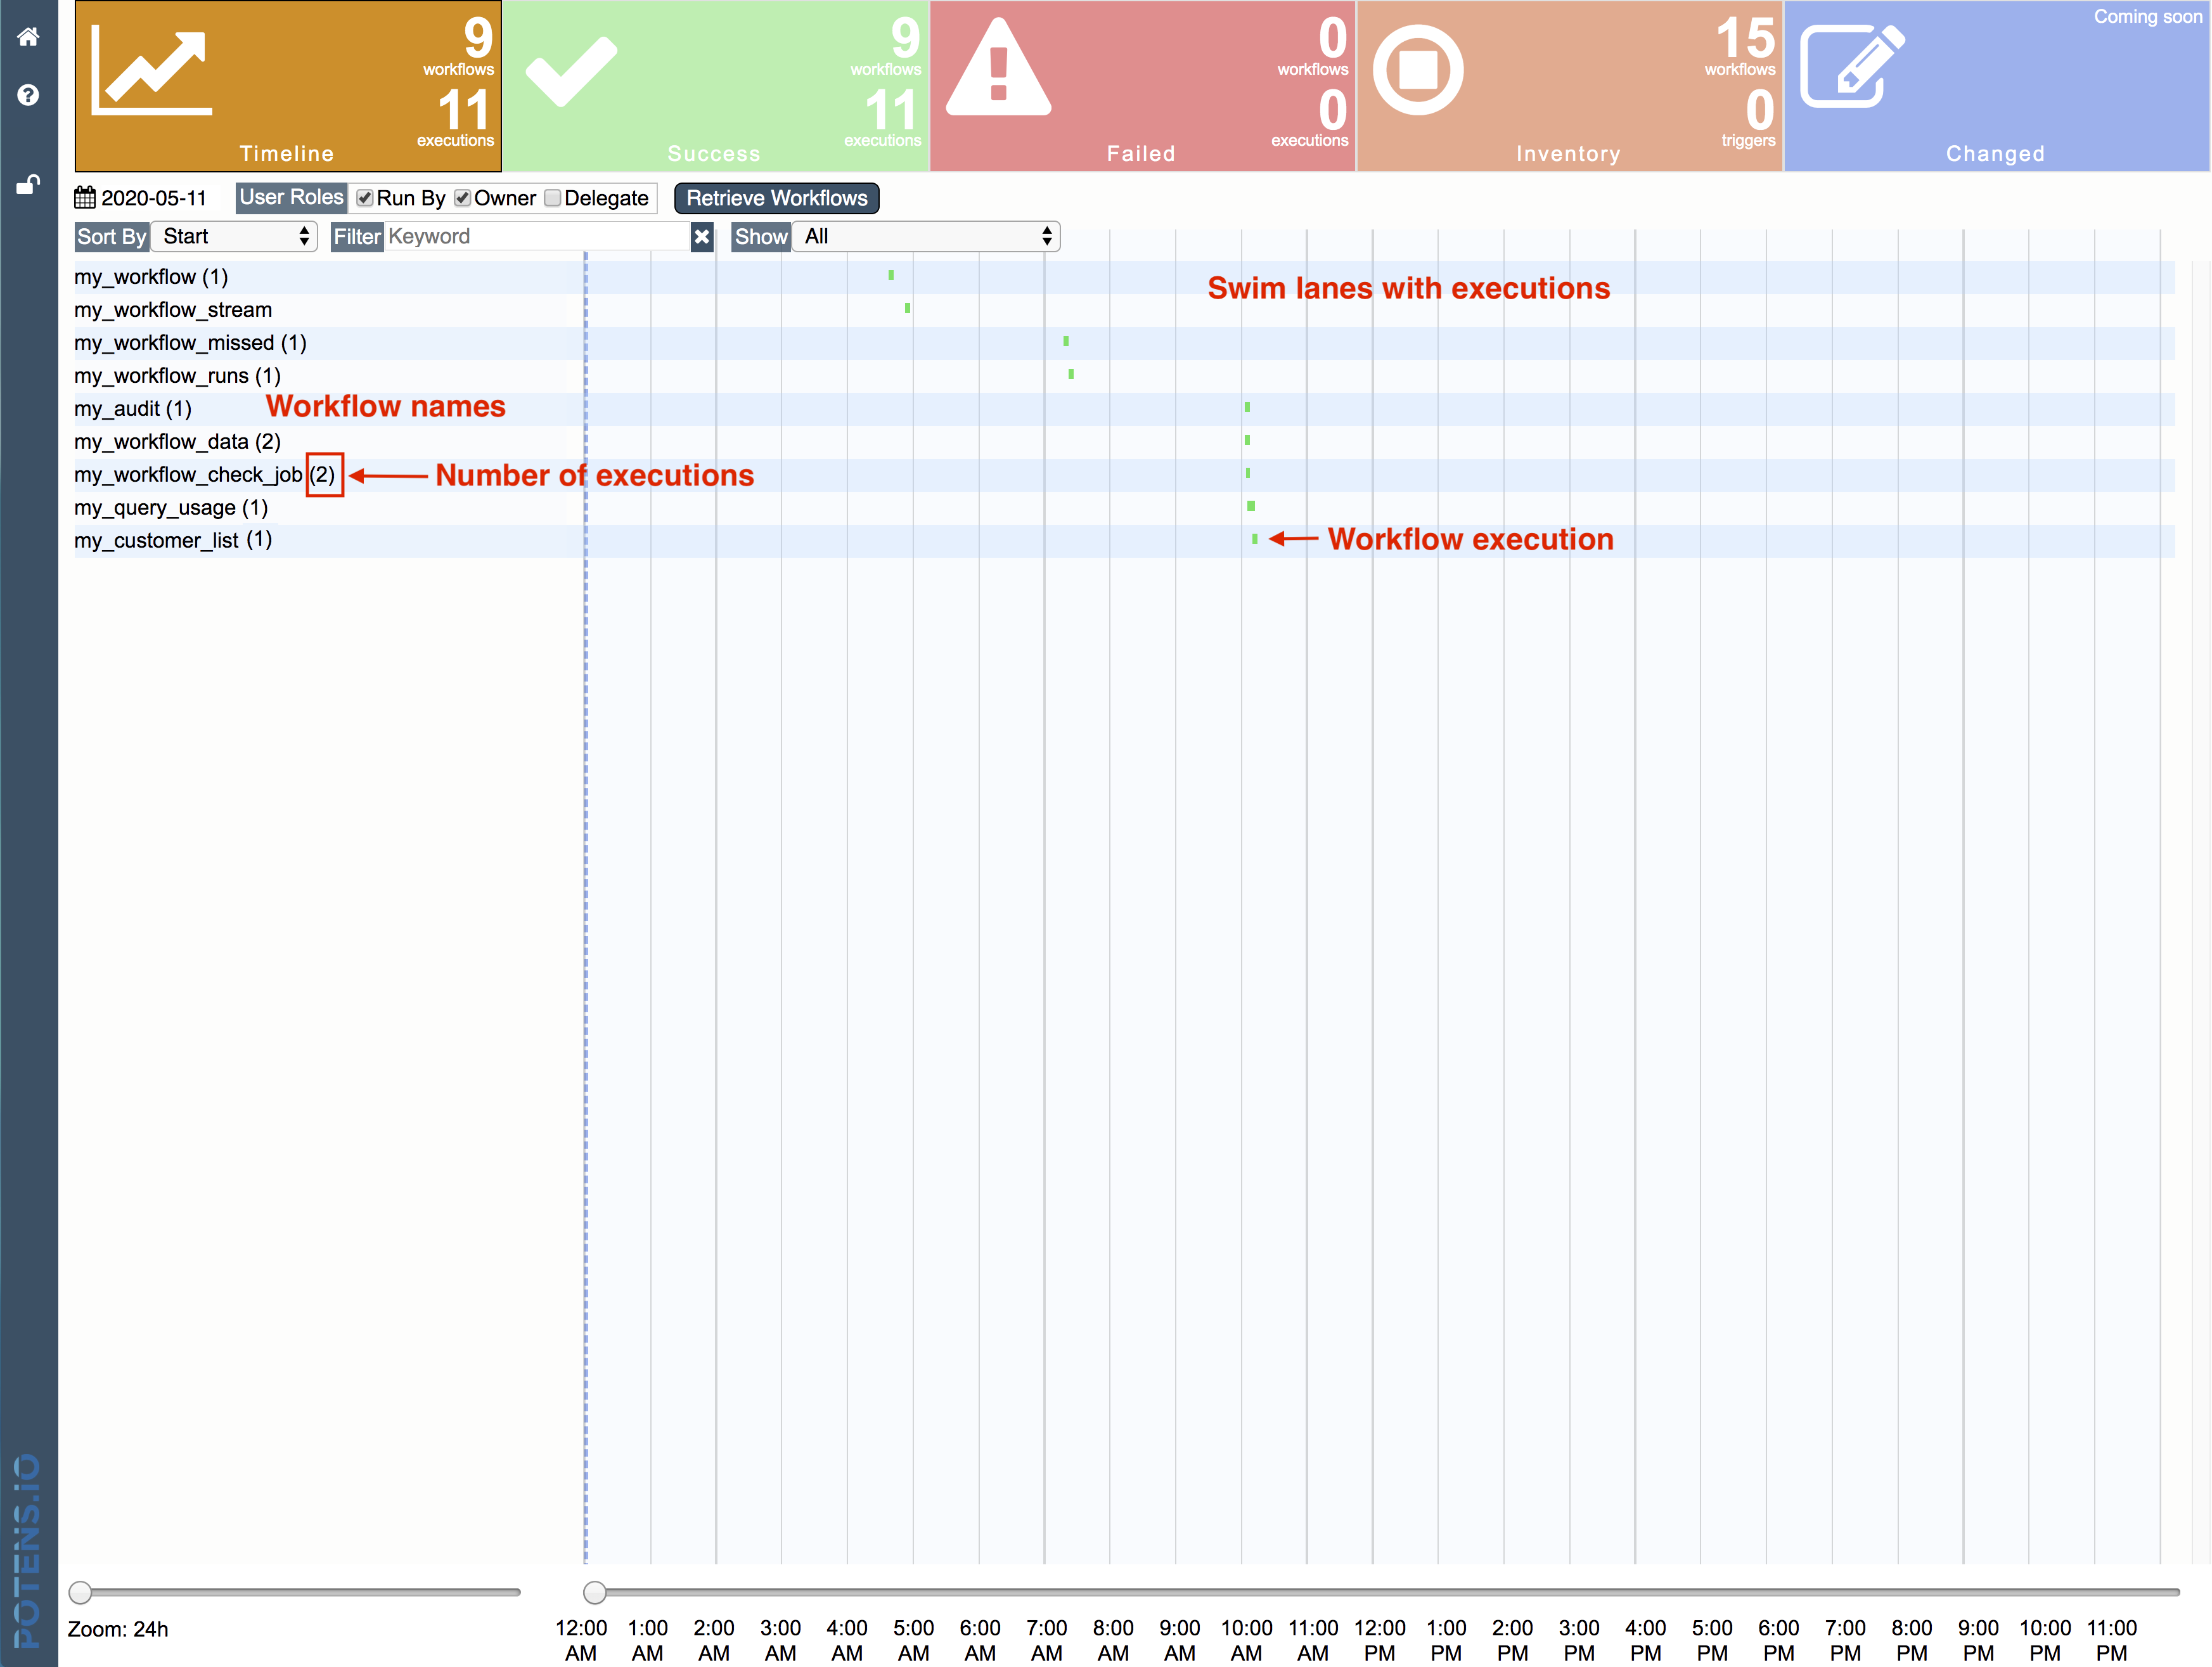
The workflow name is followed by a count, in parenthesis, indicating the total number of executions for that workflow for the period.
Hovering over the workflow name displays a popup that contains workflow related information. This includes the workflow name, the owner name, when the workflow was created, when the workflow was last modified, who modified it last, and the last time the workflow was executed.
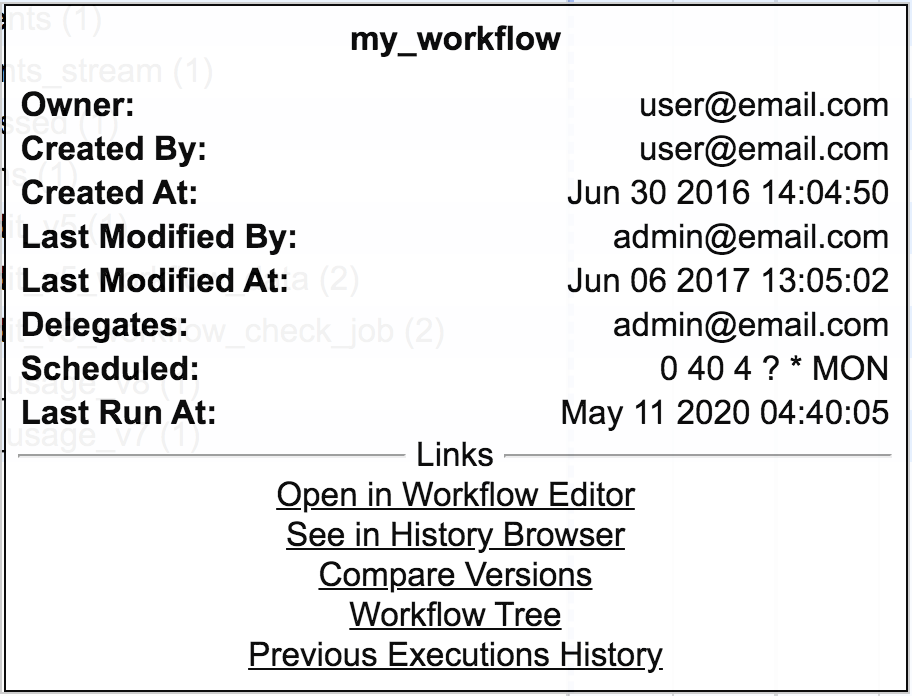
The popup also includes several links. These links include Open in Workflow Editor, See in History Browser, Workflow Tree, and Previous Execution History. The links open the selected workflow in a new tab in the respective area. Previous Execution History loads the Timeline dashboard to visualize the specific workflow over the last several days.
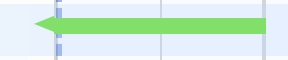
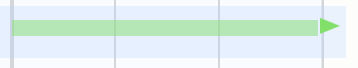
Each execution is displayed on a timeline in a position of when the execution started and has a length of its duration specifying the time when the execution ended.
If an execution started before the current period, an arrow pointing to the left will display.
If an execution did not complete before the current period, an arrow pointing to the right will display.
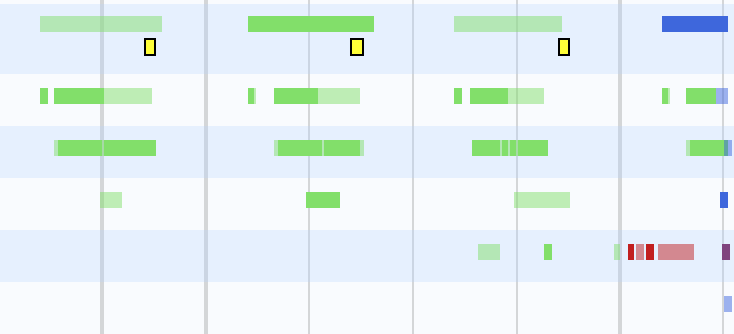
Each execution is color coded to reflect the execution status.
Green represents that the execution complete with success.
Red indicates that the execution failed with a specific workflow failure.
Yellow indicates that the workflow failed to run because another instance was already running.
Blue indicates that the execution is still running.
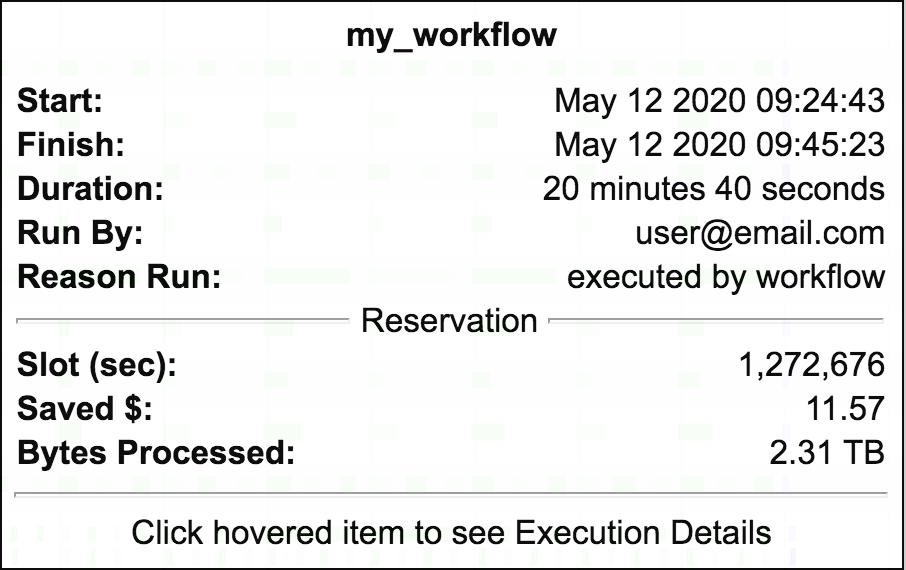
Hovering over an execution displays a popup with additional information related to the execution. This additional information includes the workflow name, the start and finish of the execution, execution duration, who executed the workflow, the reason the workflow was run, any error messages, the reason if the execution failed, who resumed the workflow in the case of resume and at what date and time the workflow resumed at, the cost of the execution along with slots and bytes billed broken out by on demand or reservation.
Clicking on the execution opens a modal that displays the execution’s run details.
Previous Executions History
Previous Executions History is a pivoted timeline visualization that focuses on a single workflow’s executions over a period of last number of days.
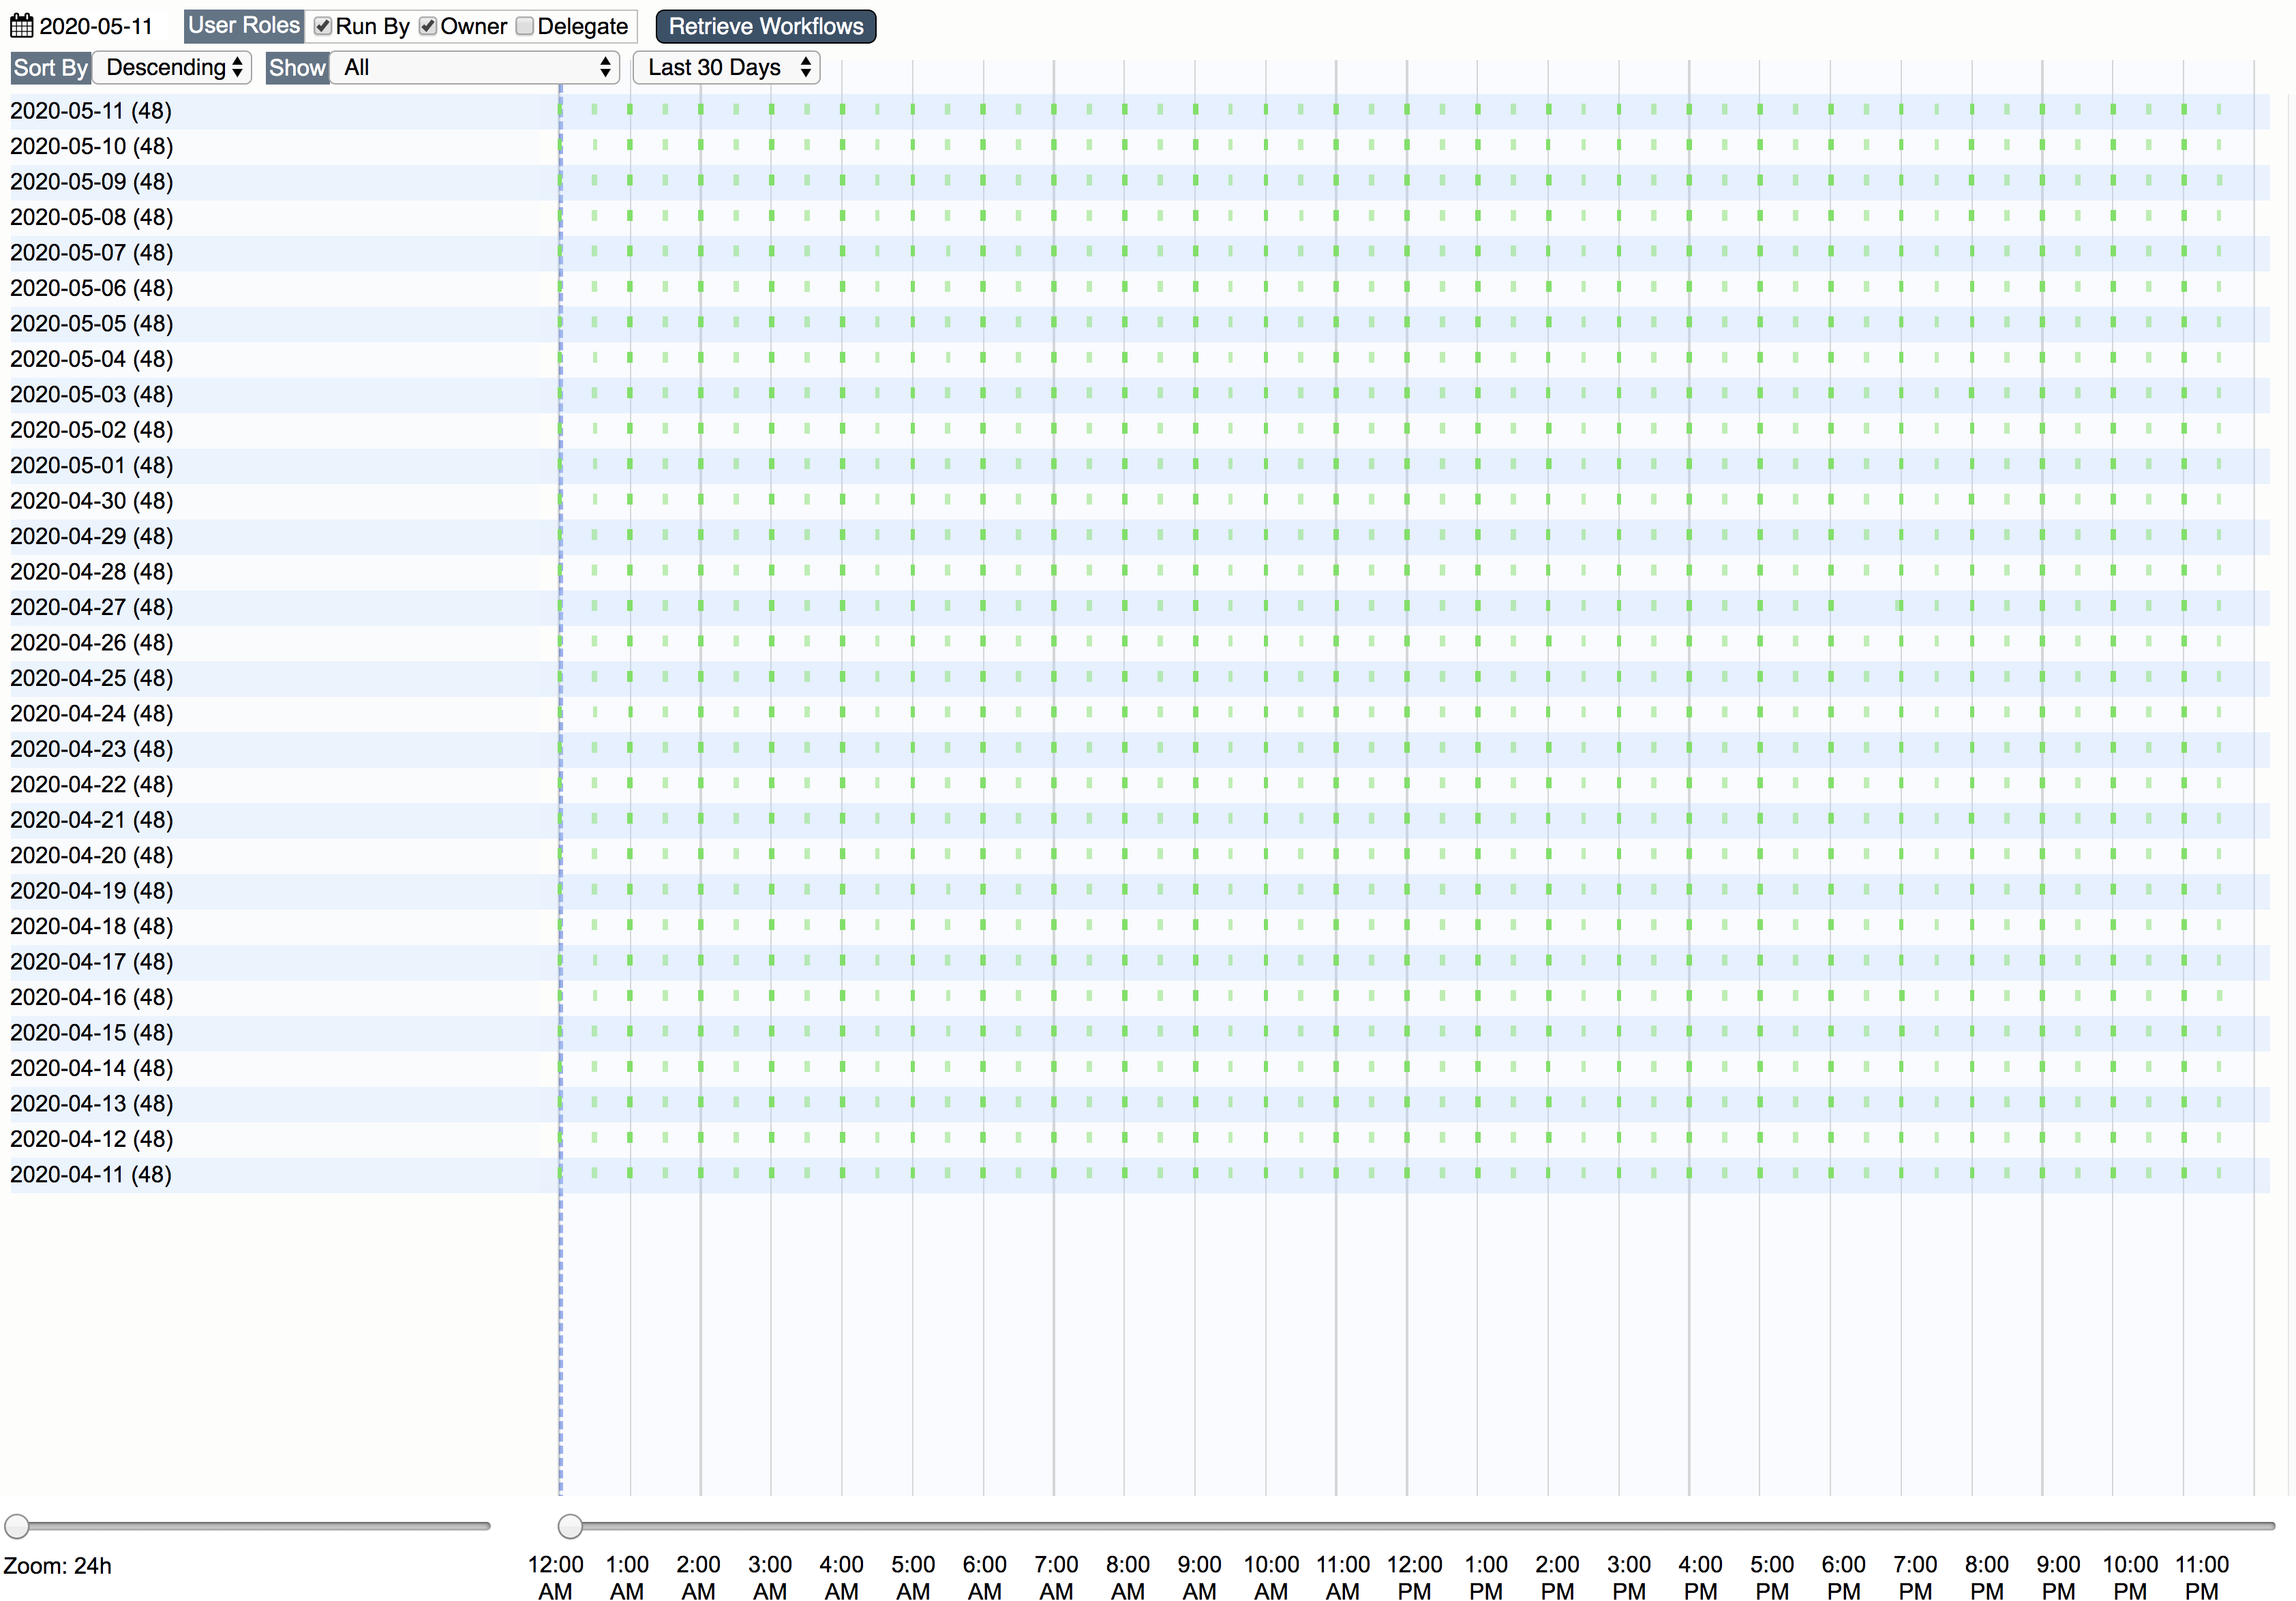
Previous Executions History can be accessed by clicking on the link in the workflow popup.
When in Previous Executions History the toolbar changes to provide options specific for the visualization.

Sort By options change to Descending and Ascending Show options remain the same, and a drop down for Last # Days is available with options for last 30, 60, 90, 120, and 180 days.
Zoom Options
Timeline visualization can be zoomed. There are two options for zooming. One is the zoom level and the other is the zoom time slider.
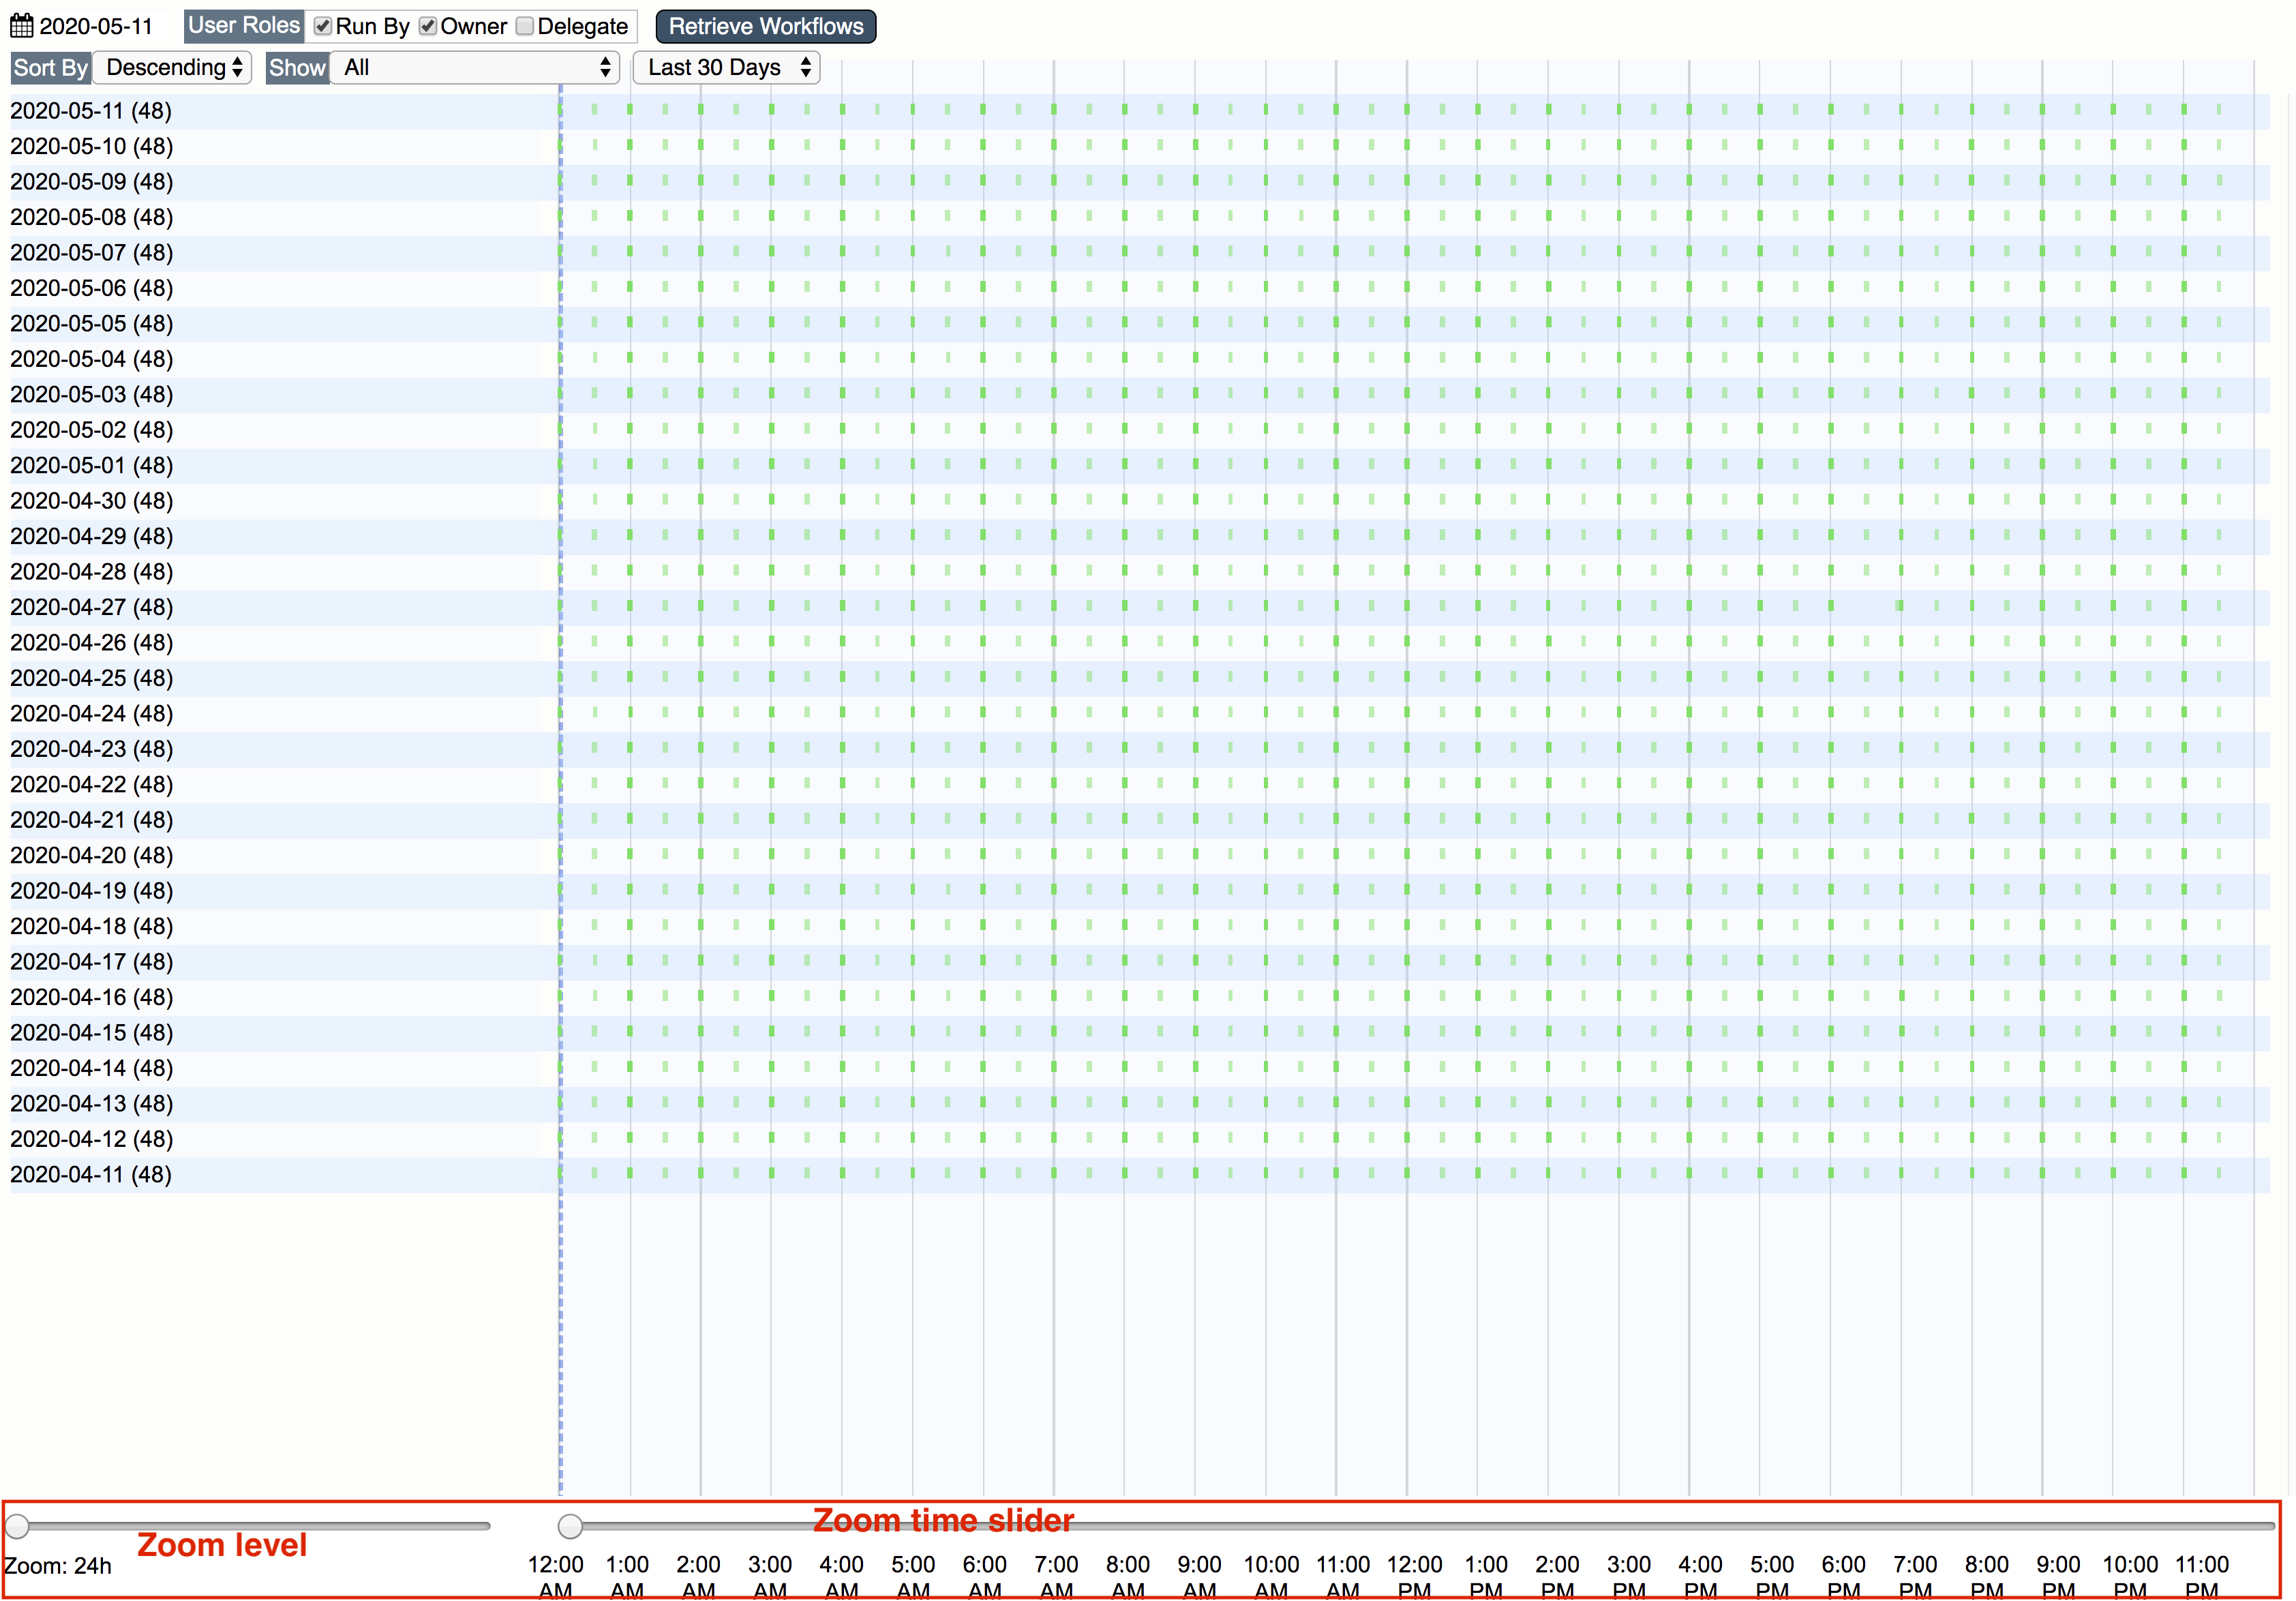
The zoom level is available on the bottom left. Sliding to the right decreases the number of hours displayed by 15 minutes all the way from 24 hours to 15 minutes. For example, sliding zoom all the way to the right will zoom into 15-minute increments for visualization.
The zoom time slider will move focus the visualization zoom level. For example, when the zoom level is 15-minute increments and the visualization displays 12:00 – 12:15 am moving the time slider to the right will display visualizations at the zoomed level for the period being slide to. For example, sliding zoom time slider to 9:15 am with a 15-minute zoom will focus a visualization for the period of 9:15 – 9:30 am.
Failed Dashboard
If there are any failed executions for the period, a breakdown of the failures is listed in the Failed dashboard. The failed dashboard displays failed workflow executions by Owner, Run By, Workflow, Error, and Workflow Error.
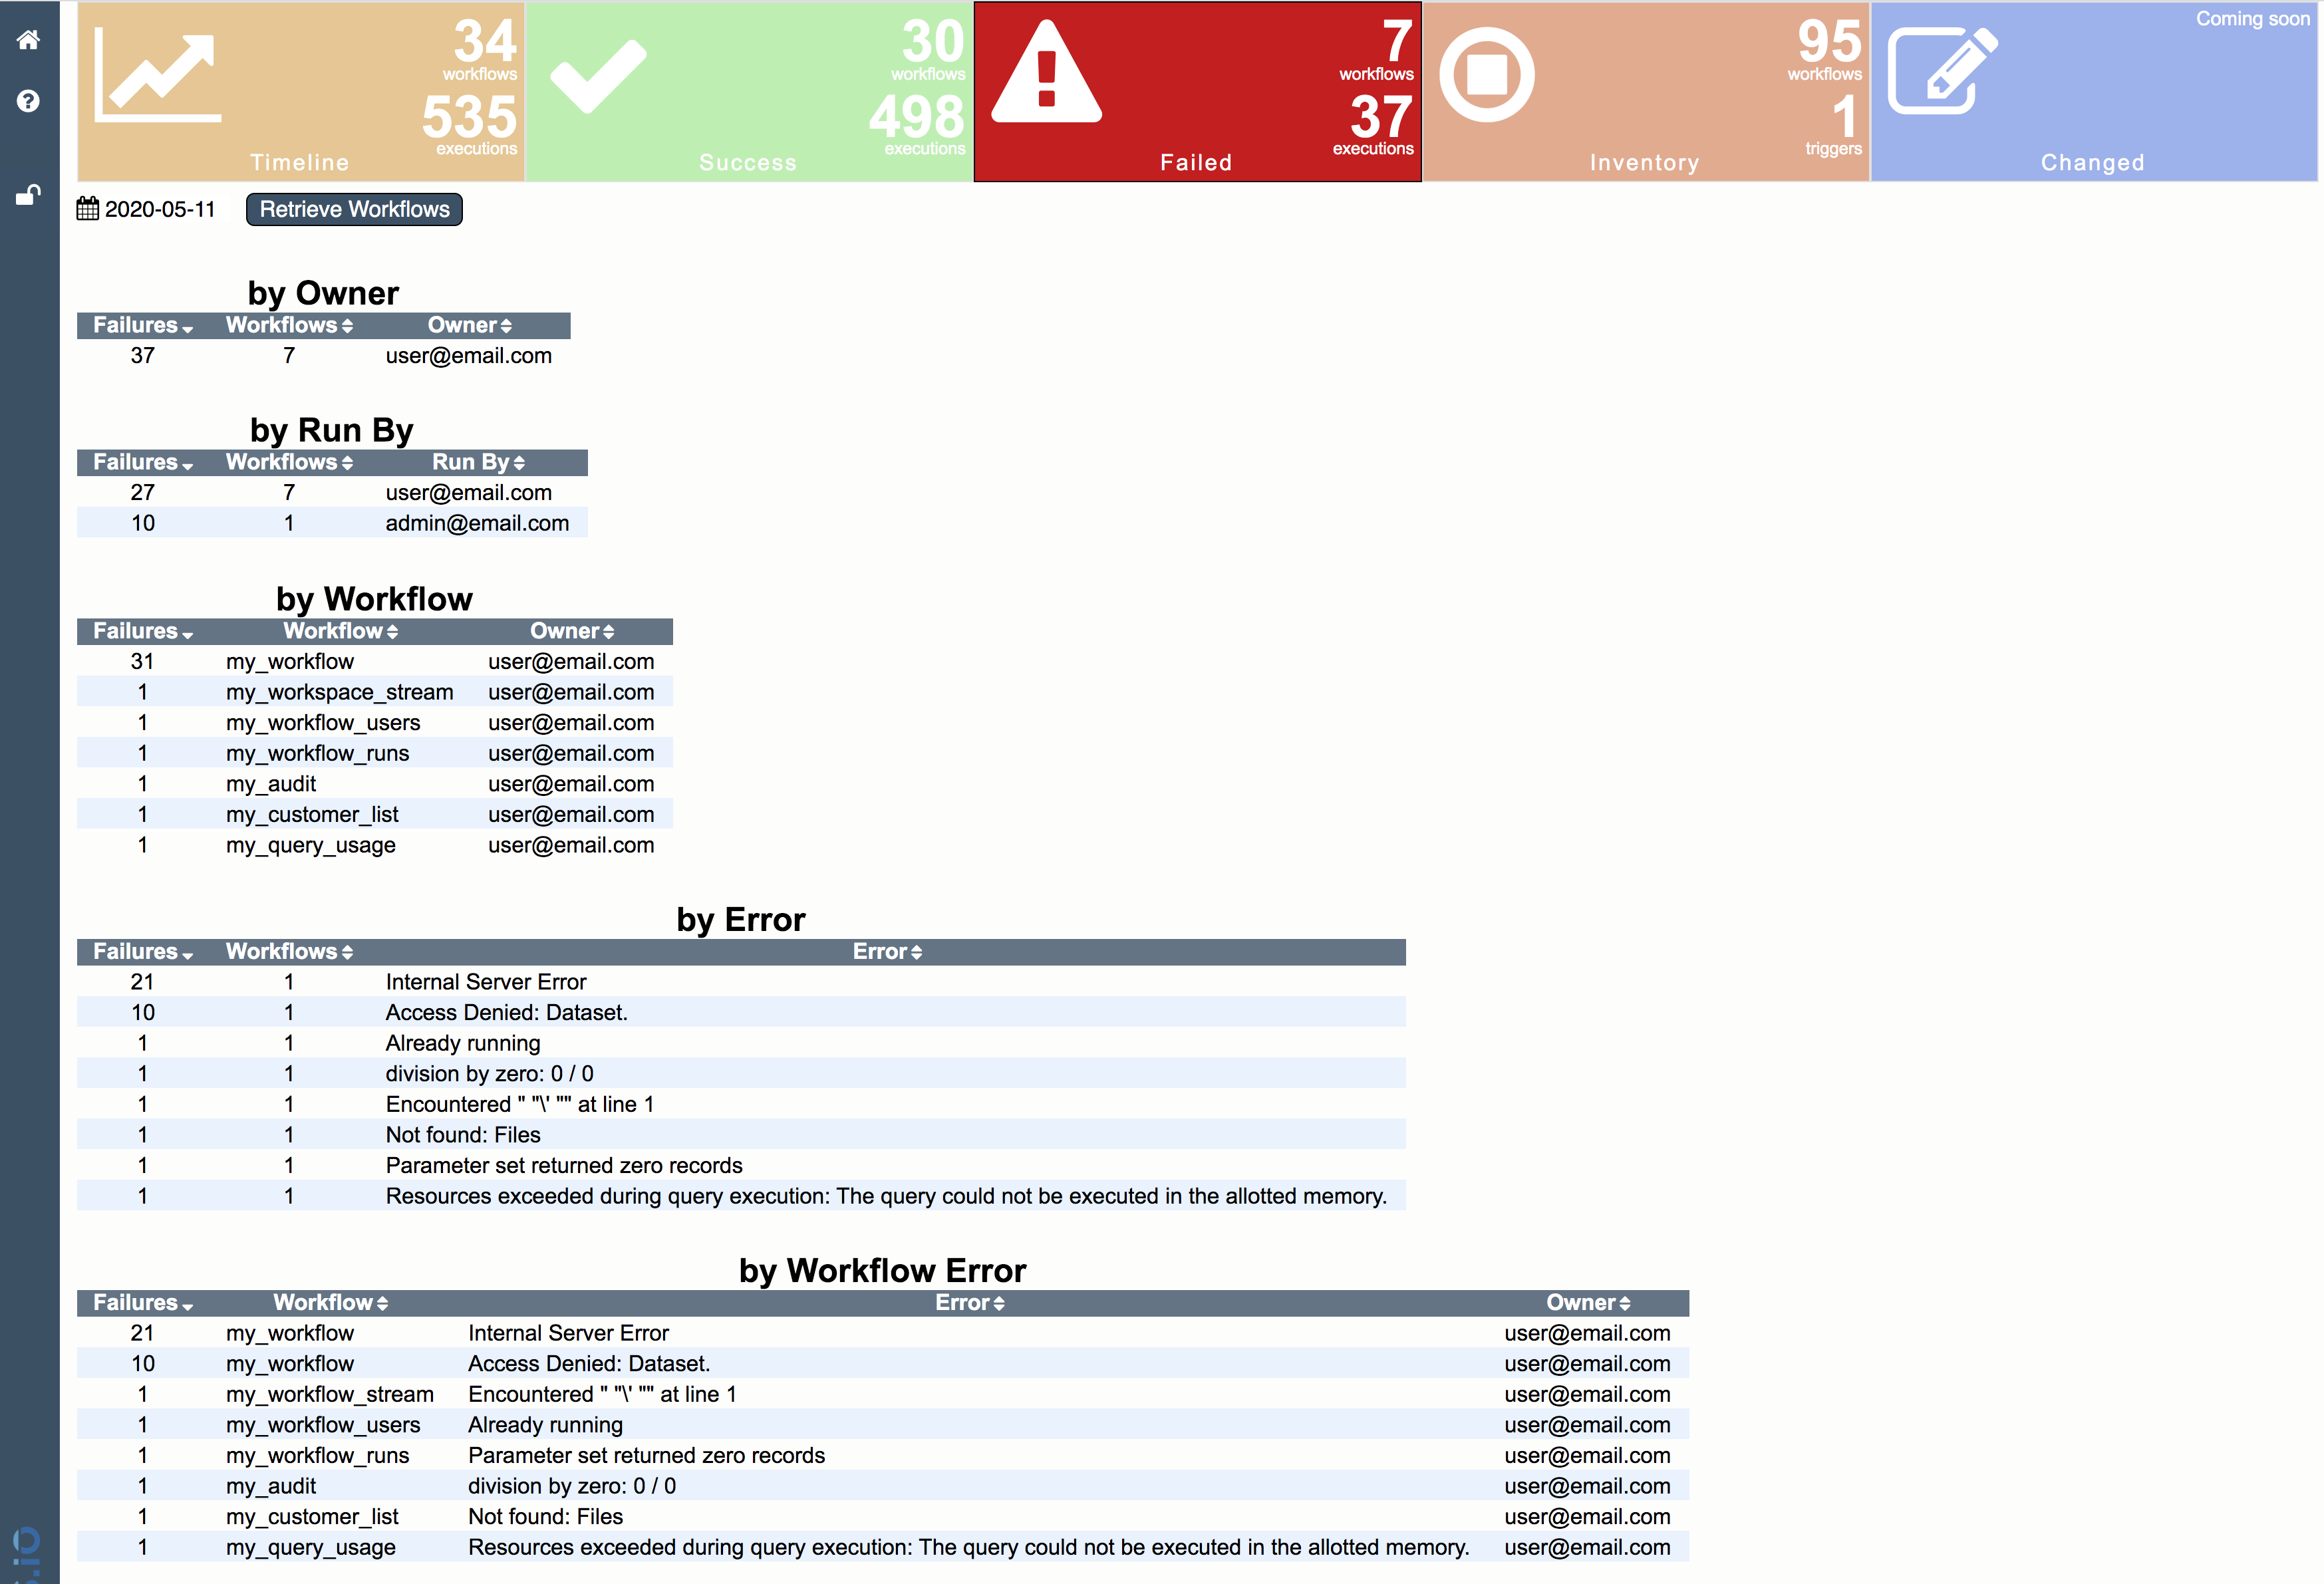
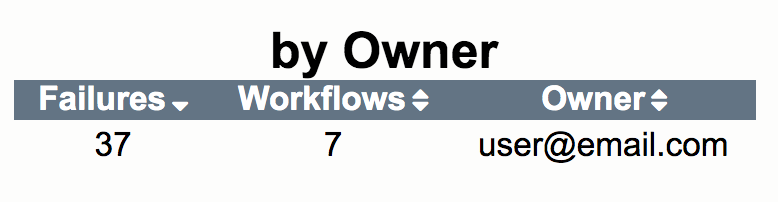
By Owner lists the count of failed executions and number of workflows by workflow owner.
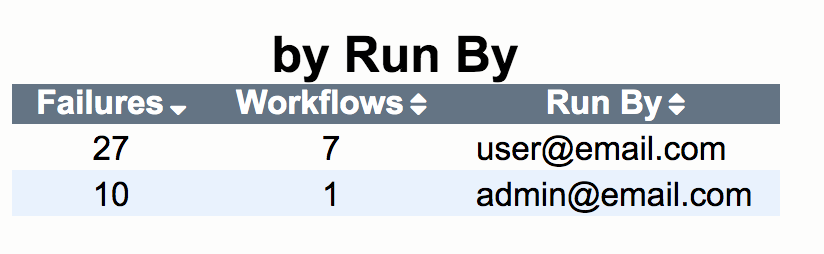
by Run By lists the count of failed executions and number of workflows by user who executed the workflow (run by).
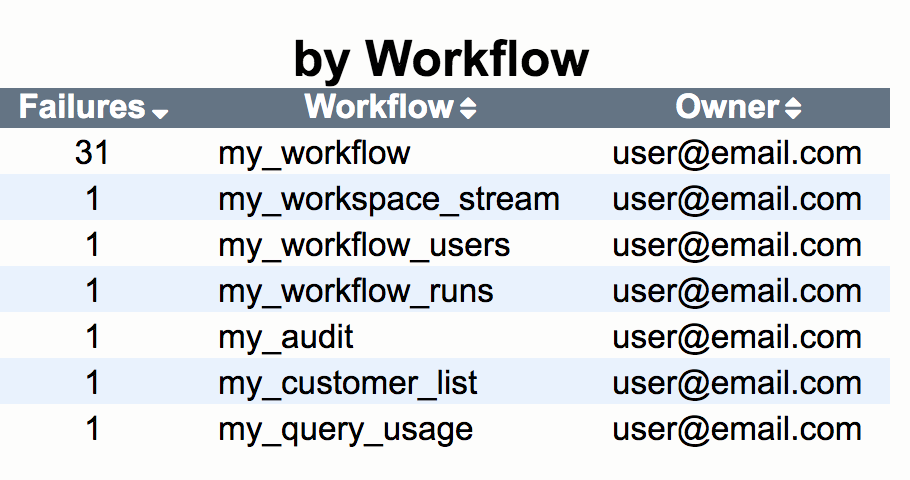
by Workflow lists the count of failed executions by workflow and owner.
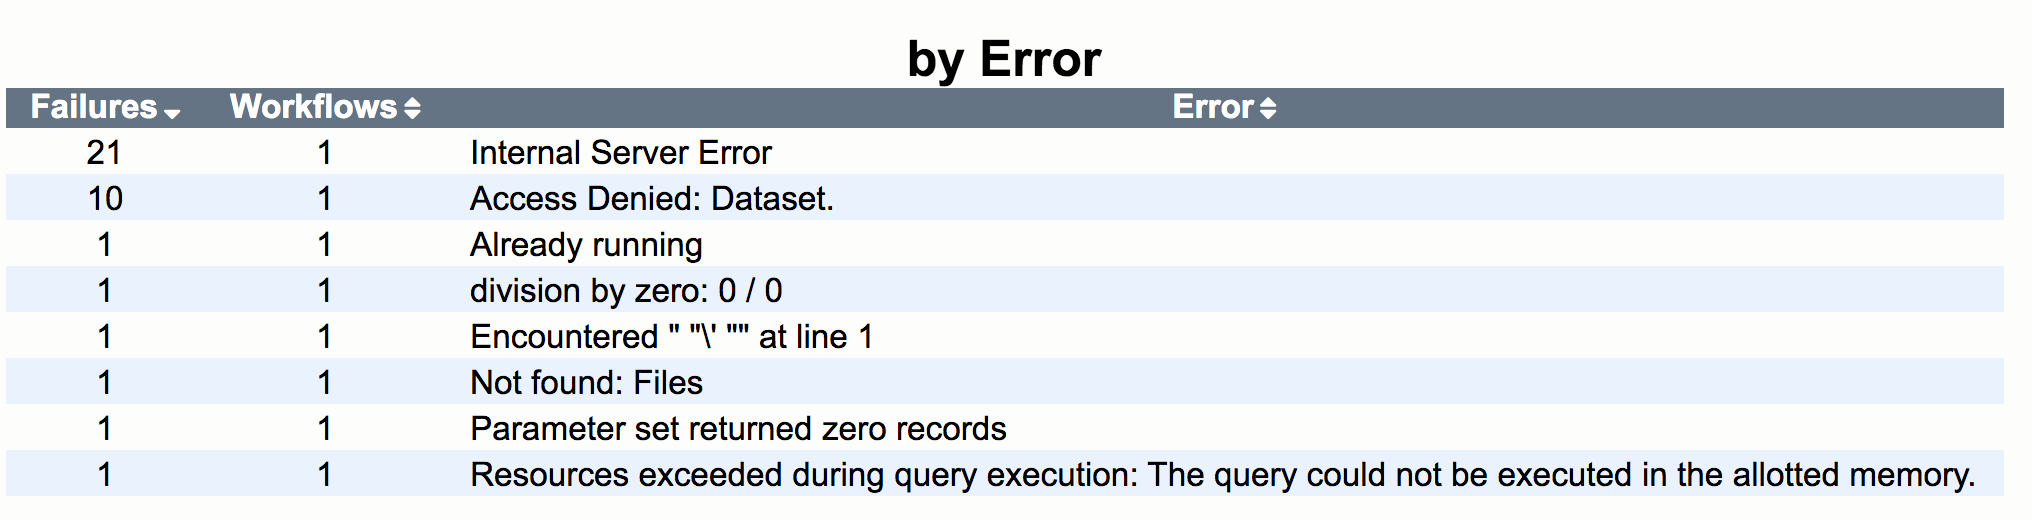
by Error lists the count of failed executions and number of workflows by error.
by Workflow Error lists the count of failed executions and number workflows by error and owner.

In each section the table can be sorted by clicking on the column name.
Inventory Dashboard
A current list of workflows and triggers is available in Inventory dashboard. The dashboard includes an overview, a list by usage, a list of owned workflows, a list of delegated workflows, and a list of triggers.
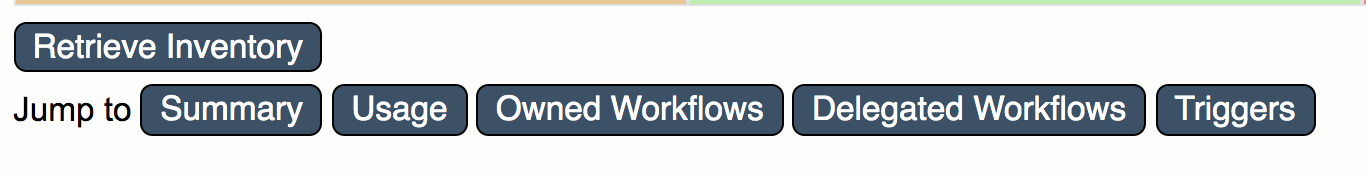
Toolbar
The Inventory dashboard toolbar includes a jump to sections. The sections include Summary, Usage, Owned Workflow, Delegated Workflows, and Triggers. Clicking on a button jumps to the selected section and brings it into view.
Sections
Overview displays the current count of workflows that are owned, that the user is delegate, and triggers broken out by trigger type.
Usage displays execution activity for owned workflows, delegated workflows, and triggers for the last 14, 60, and 180 days broken out by those items which are used and unused. Used indicates that an item, for example workflow, was executed/run within that period.
Owned Workflows displays a list of workflows the user is owner of. The list includes workflow name, if the workflow is enabled, when it was created, when it was last modified, the last time it ran, how many days until the schedule expires, the schedule date it started, the date the schedule will end, the schedule for when it runs, and a list of delegates.
Delegated Workflows displays a list of workflows the user is a delegate of. The list includes workflow name, the owner of the workflow, if the workflow is enabled, when it was created, when it was last modified, the last time it ran, how many days until the schedule expires, the schedule date it started, the date the schedule will end, the schedule for when it runs, and a list of delegates.
Triggers displays a list of triggers owned by the user. The list includes trigger name, type of trigger, the workflow the trigger executes, when the trigger was created, the last time it was modified, the last time it was run, the start date the trigger was active, and the end date for when the trigger was active.
Most sections contain columns that can be sorted. Clicking on the column will sort by that column.
Sections can also collapse/expand. To collapse/expand click on the chevron icon to the left of the section header.
Sections that contain workflow can hover over the workflow title to display a popup that contains additional information and links.